M3 – digital healthcare serial acquirer at 4.4% trailing FCF yield
(2413.T, $6.8bn market cap, $58m ADVT, 60% free float)
I spoke to M3’s investor relations manager in preparing this report. All opinions and estimates are solely my own responsibility.
M3 is a Sony-affiliated digital healthcare platform that has grown rapidly since it was founded in 2000. The core Japanese online pharmaceutical marketing business is a category killer that earns a c.50% margin and generates strong cash flow. M3’s McKinsey-trained founder has deployed the cash into a global roll-up strategy that has proved successful.
The stock spiked to absurd levels at the start of 2021, as lockdowns forced all medical marketing online. M3 duly produced blowout growth and margins, followed by a predictable period of normalisation and consolidation.
Investors have over-reacted badly to this volatility. The stock is down 86% from peak. It now trades at just 20x P/E and 4.4% trailing free cash flow yield, ahead of a potential return to healthy growth. This sets up an attractive risk-reward, despite the inherent complexity of the group with its 73 business units.
I have just started a position at the current price, and intend to average in over the coming months. Feedback is welcome as always.
Management and shareholders
Itaru Tanimura is M3’s founder-CEO. Tanimura-san was at McKinsey for twelve years, reaching partner by 1999. While working on a Sony project in that year, he proposed a new business in the healthcare industry. Sony asked him to lead it. As a result, M3 was founded in September 2000. An immediate hit, the IPO followed in September 2004, by which time the business was already firmly profitable.
Today, Tanimura-san continues to lead M3 as CEO. He owns a 2.9% stake, down from 6.5% immediately after IPO.
M3’s executive team includes Aki Tomaru, based in the US, who leads the US and European businesses. He is also from McKinsey, and joined M3 to run the US operations way back in 2003.
Eiji Tsuchiya joined M3 in 2006 and heads the Business Development division, in charge of M&A evaluation. Rie Nakamura was hired in 2022 to lead the fast-growing Clinic DX Support SaaS operations. Yoshinao Tanaka manages the consumer-facing businesses. Satoshi Yamazaki is the CTO in charge of the engineering division.
Sony owned 74.8% of M3 post IPO. They cut their stake to 60% by 2006, to 50% by 2013 and to 39% by 2015. Their last sell-down was to 34% in January 2017, since when they have held their stake stable.
NTT Docomo owns 3% after M3 sold shares to them in April 2019, raising ¥50bn to fund M&A. That was the sole equity issuance since the IPO. The share count is up 10% in 20 years, reflecting the equity raise as well as gradual dilution from share option issuance with no offsetting buybacks.
Baillie Gifford took an 8.7% stake in November 2015, and continued to hold over 8% until December 2023. Their most recent notification puts them on 4.1%.
Background
The original business was MR-Kun, an online platform for Japanese doctors and healthcare professionals. Monetisation is mainly from pharmaceutical companies who pay to promote their drugs to doctors on the platform.
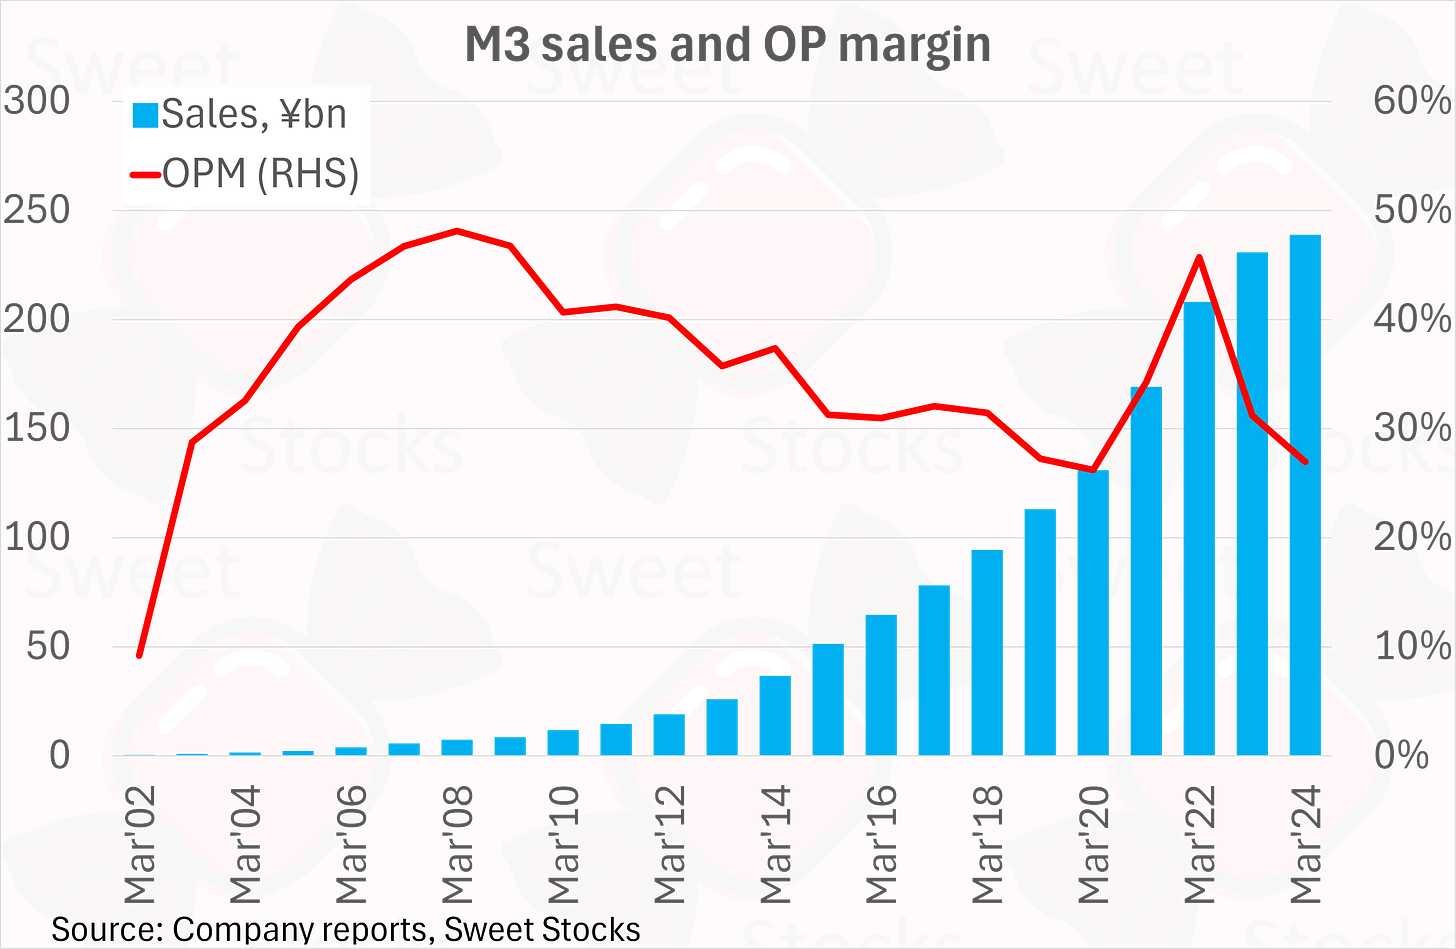
This business was highly profitable almost immediately, with a 33% operating margin in the year to March 2004, even before the IPO which took place in September 2004. The full track record is shown in my chart below: the profit margin peaked at 48% back in March 2008, but on far lower revenue.
From early on, Tanimura-san decided to use the cashflows to fund an M&A programme. M3 expanded into adjacent healthcare business areas in Japan, including recruitment for healthcare professionals, market research and medical trials businesses. They also bought similar healthcare businesses globally. The first acquisition was in 2002, and M3 bought MDLinx in the US in 2006, but it was from 2010 and onwards that M&A really accelerated.
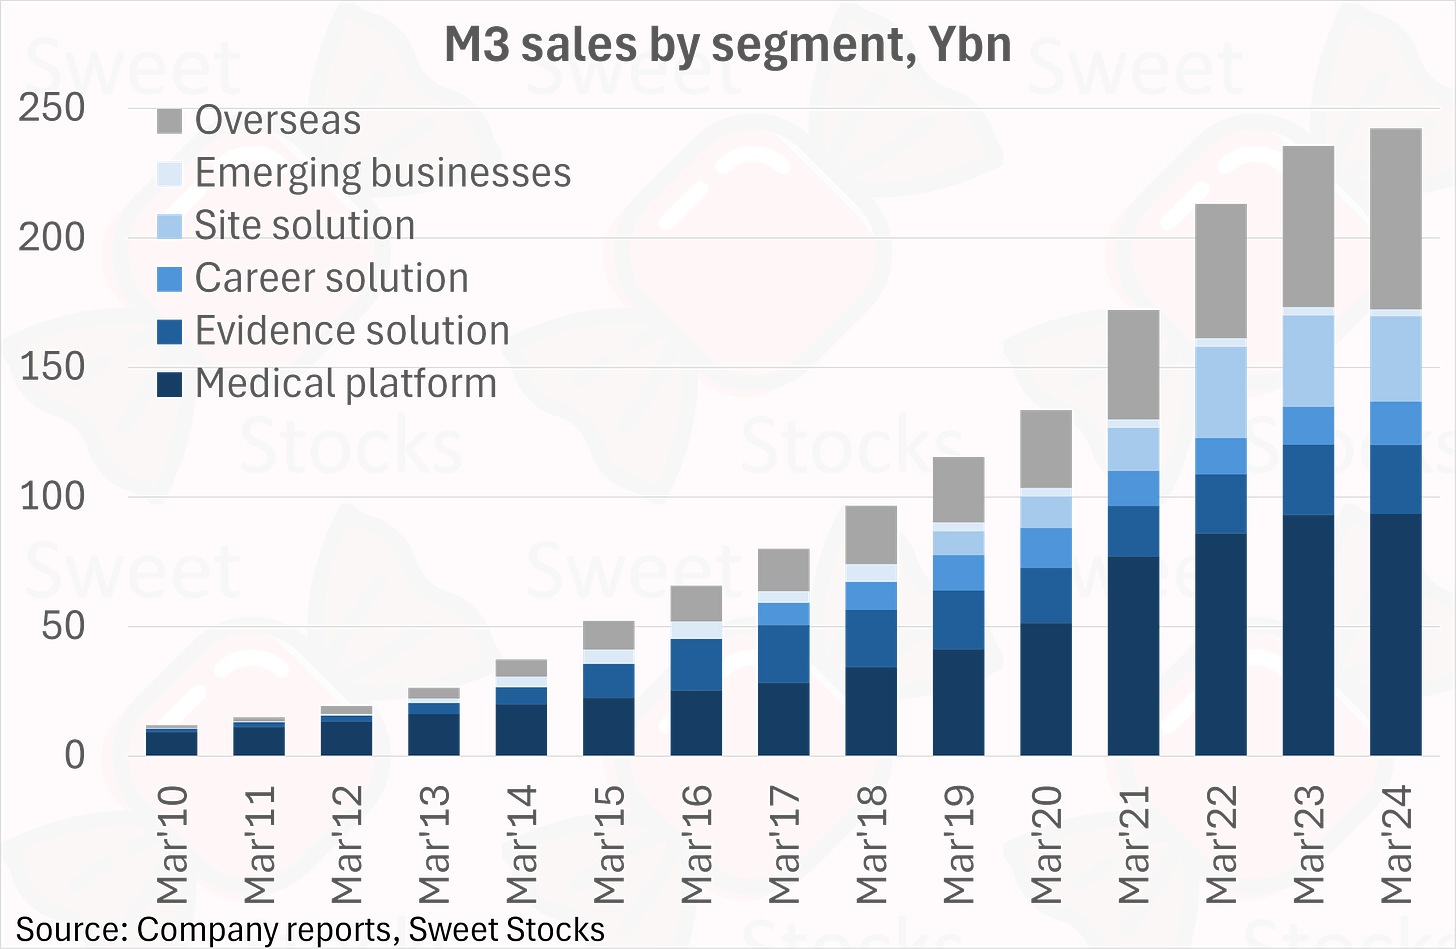
By segment, the split is 39% from Medical Platform, 29% from the various Overseas businesses, and the balance from the Evidence Solution, Career Solution and Site Solution domestic businesses. My chart below shows how the mix has evolved over time, with overseas gradually becoming bigger.
The profit split is different, with 55% from the lucrative Medical Platform segment, and just 24% from the less profitable Overseas segment. My chart below shows the high 41% margin for the Medical Platform segment, compared to the still-respectable but far lower 19% and 25% margins for the other domestic segments and Overseas.
Medical Platform itself contains a number of businesses.
· Pharmaceutical marketing support is the original core business and the most lucrative. This still accounted for over half the segment sales in the year to March 2024, and an even greater percentage of profit, according to IR. It has been shrinking since the Mar’22 peak on post-COVID normalisation.
· Clinic DX Support, aka digitalisation support for medical practices, is over 10% of the segment total. This is the DigiKar cloud electronic medical records business, as well as DigiKar Smart for appointments, payments etc. It is growing nicely at around 20% yoy.
· Medical equipment wholesale is next biggest at around 8% of segment sales. The focus is on cardiovascular and ophthalmology devices. This 2017 deck explains the thinking behind entering this field – I would describe it as not compelling, but harmless enough.
· White-Jack Project offers occupational health services, led by the annual health checkup which corporates must offer their employees. More below in the M&A section.
Marketing support is by far the most profitable business. Its post-Covid decline has been dilutive to the Medical Platform segment margin, as can be seen in the margin chart above.
Pharmaceutical marketing support in more detail
M3 works with a wide range of Japanese and foreign pharmaceutical customers to educate physicians about specific drugs. Contract terms are by project, with 6-12 months typical duration. The revenue model includes a fixed fee per project (recognised pro rata over time), as well as volume-based fees related to content delivery to physicians.
Projects may be exclusive or shared – some pharma companies are more price-sensitive than others. Coverage of physicians is a competitive factor: it’s a big advantage to have close to universal reach.
Pharmaceutical marketing is strictly regulated in Japan. Advertising to the general public is prohibited. Before M3 came along, drug companies had only one tool to market their drugs – MRs (medical representatives) who visit doctors in person.
M3 takes pains to verify the identity and credentials of every physician who joins its website, making it a compliant platform for drug marketing. Ever since 2000, it has been taking share from MRs, as the slide below shows.
The slide shows three services. (1) Internet marketing support is direct substitution of MRs by content provision for users of M3.com. In this activity M3 competes against the other three online physician marketing platforms detailed below. However, M3 also aims to provide (2) MR activity digital support and (3) data-driven marketing support, with limited competition as yet. M3’s sales split within its overall marketing support business is 67% to 25% to 8%, with (2) and (3) growing much faster than (1). There’s said to be no difference in OP margin.
The industry reduction of MR headcount is quantified below. This is potentially to M3’s advantage, as drug companies reduce spend on reps and potentially allocate more to online marketing.
The key problem for M3 has been a post-Covid fall in revenues, following the big run-up. It is unhelpful that M3 stopped disclosing precise revenue figures for the Marketing Support business since 2018. My chart below shows my estimates, based on guidance from IR.
The continued post-Covid decline has unnerved investors, and is the main factor that has driven the stock’s multiple lower, in my view. After the Mar’22 peak, the yoy decline was low single-digit in Mar’23, high single-digit in Mar’24 and then double-digit in the six months to Sep’24.
The slide below in M3’s latest deck has not reassured, with investors preferring to wait for proof of a positive inflection.
M3’s direct competitors in pharmaceutical marketing support are Carenet (2150.T, $172m market cap), Medpeer (6095.T, $70m market cap), and the unlisted Nikkei Medical Online. The four have 98% of the market between them.
M3 estimates that its market share has declined slightly from 70% to 65% in recent years, as Carenet and Medpeer aim to take share with price competition.
CareNet and MedPeer’s trailing sales growth and margins are shown in the charts below. CareNet returned to growth in the most recent quarter and remains nicely profitable, while MedPeer is struggling on both fronts.
(A deep dive on CareNet in particular would be a key focus for further research. In the meantime, I would greatly appreciate any comments from those who are familiar with these two names in terms of how they perceive the nature of competition with M3.)
The post-Covid hangover quantified
M3 benefited greatly from Covid, both as a general winner from the fact that face-to-face marketing was suspended, and also in specific terms thanks to directly Covid-related revenues to support testing, vaccine trials and so on.
My chart below shows the impact of the Covid revenues on M3. The growth rate spiked up to a peak of 25% year on year, and since then the reactionary slump has seen revenues slow to just 10% growth (which includes benefits from M&A and weak yen), as specific Covid revenues slowly dwindle away.
The impact on profits is even larger, given that marketing support was one of the significantly affected businesses with its outsized profit margin.
Beyond marketing support – M3 as a serial acquirer
M3 has acquired about 130 companies since 2010, averaging 9-10 deals per year. This programmatic M&A strategy might sound terrifying. In fact there is evidence of a thoughtful approach that has led to value creation, as I demonstrate below.
M3 has invested about Y120bn into M&A since the Mar’10 year, by my count – see chart below derived from the cash flow statements. The average spend per deal has been less than Y1bn, and the median must be lower still. However, M3 has more recently shown interest in much bigger deals, as detailed below.
Has M3 been overpaying for acquisitions? No, it doesn’t look like it. Based on the information disclosed in the footnotes to the Yuho securities reports, I have data on deals from FY17 to FY24 inclusive covering Y97bn of enterprise value. These deals, had they been completed on the first business day of the year, would have contributed a cumulative Y59bn of revenue and Y5.5bn of net profit during the year of completion, implying that M3 paid on average 1.6x EV to sales and 12.4x EV to EBIT. These are attractive multiples, given the evidence I show below that M3 is buying businesses that continue to grow fast under its ownership.
M3 is now present in 17 countries, led by online doctor panel businesses that monetise via advertising, market research, subscription revenue, recruitment or a combination. All acquisitions should follow this logic, with plenty of scope to fill in country-capability gaps.
M3 does integrate businesses both within countries or regions and by function. It also works to achieve synergies, as job ads make clear. For example, a Global Director of Incentives and Loyalty is being hired to “design, implement, and manage global incentive programs tailored to healthcare professionals and patients participating in our market research panels” . The new recruit will “oversee the execution of incentive programs on a global scale, ensuring consistency and compliance with regional regulations”, which speaks to integration and harmonisation of the individual businesses in many countries that offer market research.
Elan (6099.T) was a much larger than average recent deal: in October 2024 M3 acquired a 55% controlling stake for Y35bn via a tender offer. The business remains listed. Elan is a strong business in its own right. It supplies kits (‘care support sets’) to hospital in-patients, including daily rental and laundry of gowns, towels and other daily necessities. (These items are not provided by the hospital in the Japanese model, unlike in other countries.) Elan has de-rated to below 20x P/E on some margin pressure, despite continued double-digit growth. M3 expects to derive synergies from Elan’s relationships with hospitals.
In November 2023, M3 launched a tender offer for Benefit One, a listed corporate benefits leader. At Y140bn, this was by far the biggest M&A M3 had attempted. The vision was to turbocharge M3’s White-Jack occupational health focus, as mentioned above. In my view, this was a reasonable plan. However, the scale of ambition might have unnerved some M3 investors. The deal was to have been funded by debt and cash-on-hand, with no plan for equity issuance.
In the event, M3 lost out to Dai-ichi Life in a rare bidding war. Dai-ichi ultimately paid Y2,173 per share, compared to M3’s initial Y1,600 proposal. M3 showed discipline by refraining from outbidding Dai-ichi.
M3 overseas – a test case for its M&A capabilities
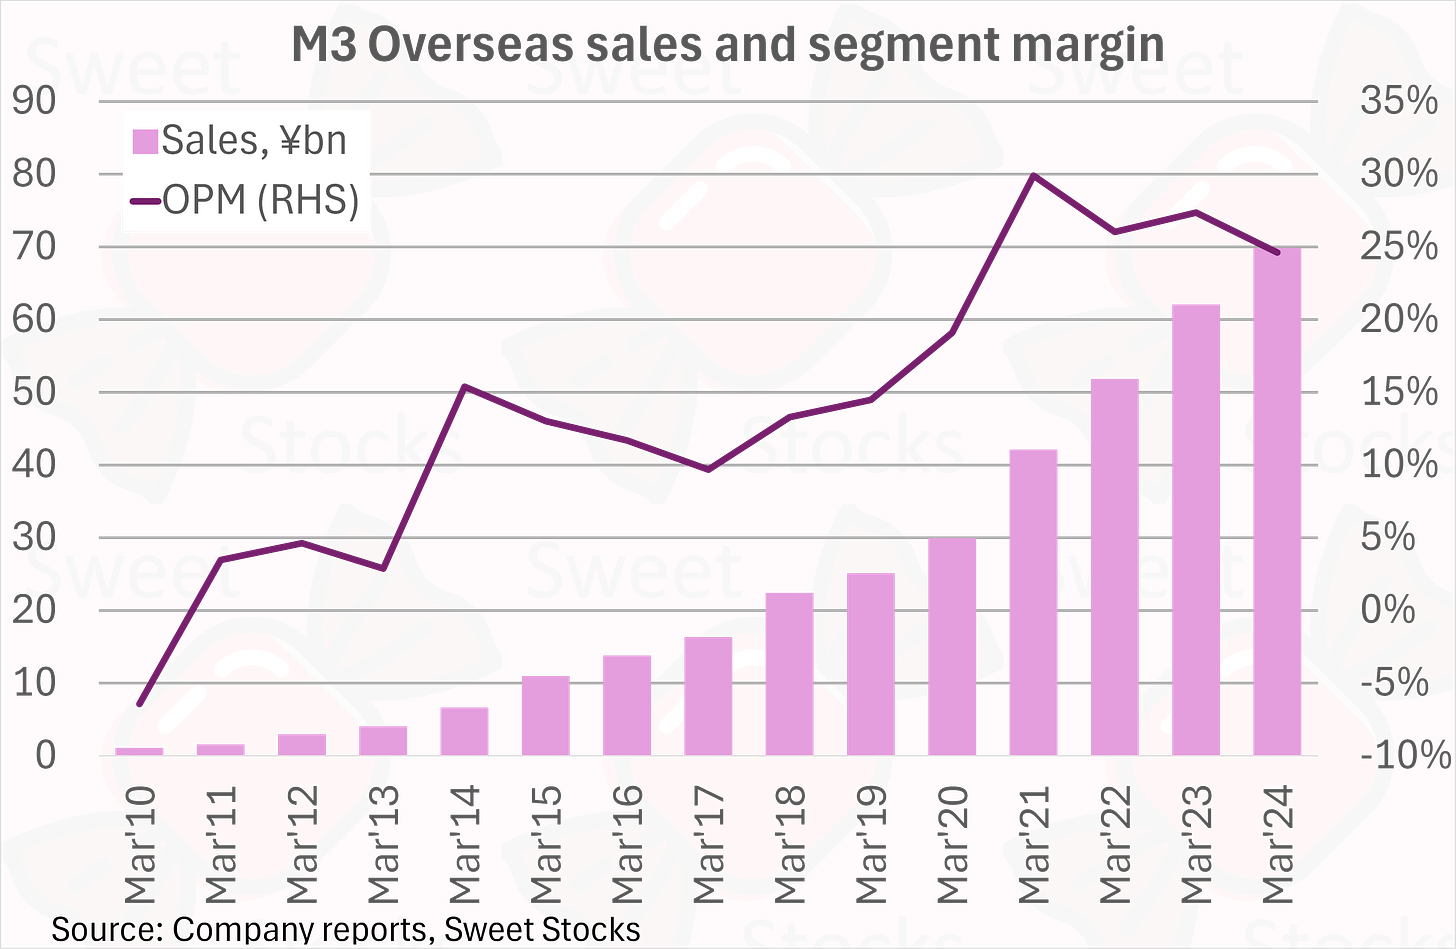
M3’s entire overseas business has been put together via M&A. So it is worth looking at the overseas business more closely. If it appears to have an attractive profile of profitable growth, then that is prima facie evidence that M3’s long-running acquisition programme has been achieving sensible results.
Below is the track record for M3’s Overseas segment. They have indeed built a strong and profitable business, including leading online medical platforms in several countries.
By region, the sales split is 41% North America, 39% Europe and 20% Other (Asia). For profitability, this is reversed, with Asia enjoying the highest margin, followed by Europe, and US the lowest.
M3’s Korean business, MediC&C, is most similar to the core Japanese pharma marketing business. It has the highest margin among the overseas businesses at 53% in the most recent year, albeit on a small revenue base of just W13bn or c.$9m. M3 owns 40% of MediC&C, but consolidates it due to board control.
India is small but growing. China was a major success story for M3, as they built the Medlive Technology business (similar online pharma marketing model) which they floated in Hong Kong in mid 2021 (2192.HK, USD942m market cap). M3 continues to hold a 36% stake in Medlive as an equity method investment. Medlive is delivering strong profitable growth. It is integrated into the global M3 network to a decent extent, judging by the connected transactions disclosed between Medlive and M3’s US and European operations (for example, covering global market research mandates).
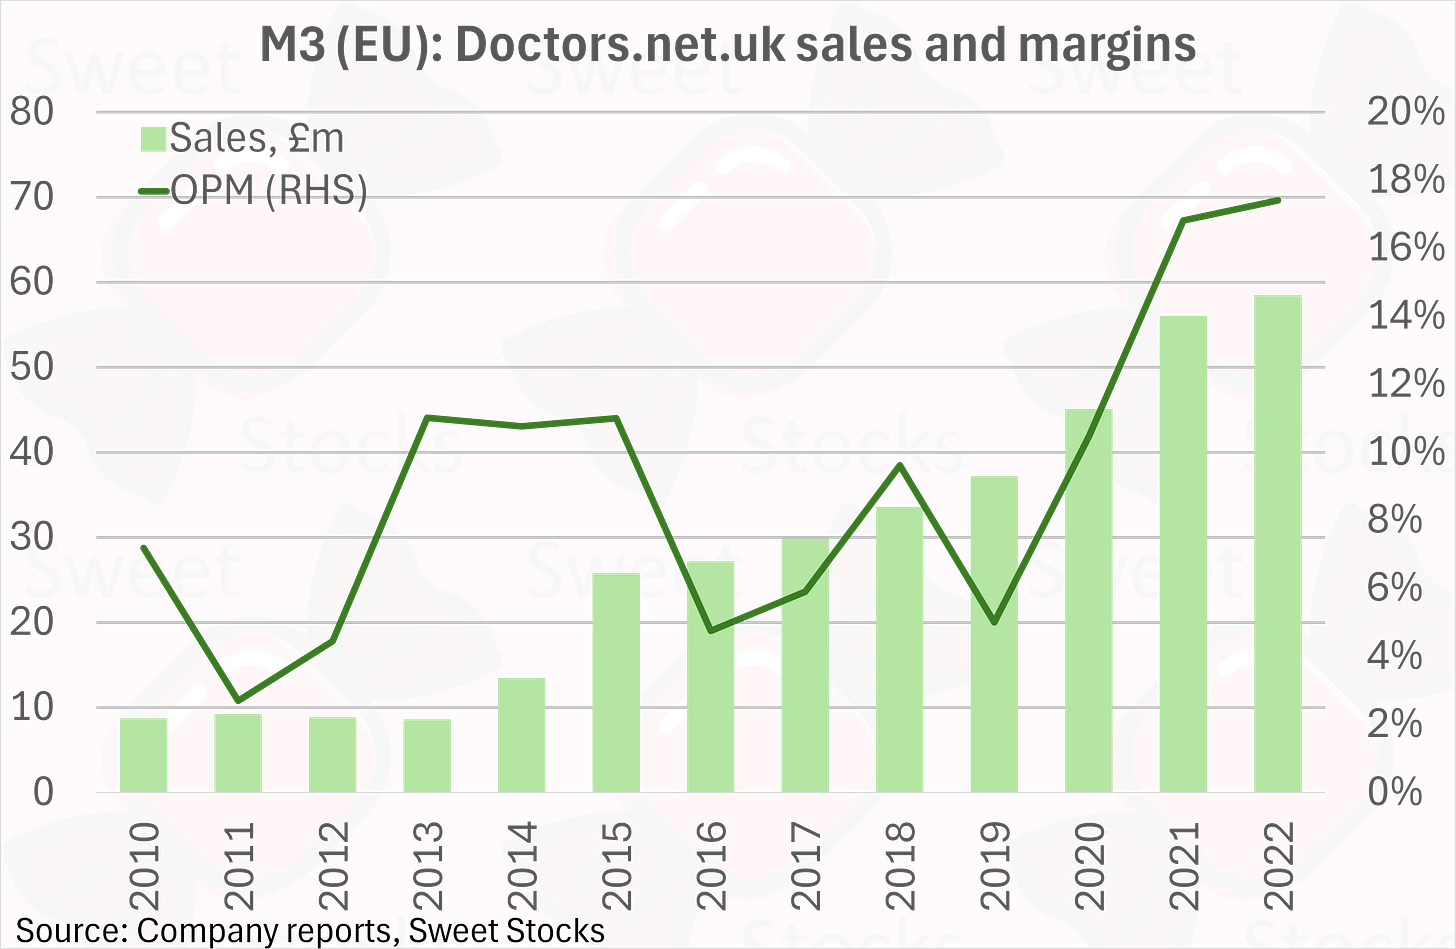
In Europe, M3’s key countries are the UK and France. In the UK, M3 owns the Doctors.net.uk business, with market research and recruitment advertising the main revenue drivers. My chart below shows the combined UK business was nicely profitable through 2022, with 2023 subsidiary accounts still pending.
In France, M3 acquired Vidal in 2016. Vidal provides an online database of pharmaceutical products to physicians across France on a subscription basis. The brand is long established, as Vidal previously published a paper dictionary version. M3 is expanding into electronic health records.
M3 is active across a number of other European countries, including Germany, Sweden and Spain.
In the US, M3 goes to market with four models, led by recruitment and market research.
M3’s global market research platform looks particularly interesting. Following the 2023 acquisition of Kantar’s specialist healthcare businesses, M3 appears to have positioned itself as the leader in the healthcare vertical. During my work on YouGov, I found that specialised, qualified panels within a vertical B2B area are valuable assets.
M3 financials – the proof of the pudding
M3’s level of disclosure is good, including English-language presentation materials dating all the way back to 2007. M3 don’t routinely split out revenue growth into organic, M&A and FX contributions each period. What they do provide is a cohort analysis, as below (where FY2023 means the year ended March 2024).
Even ignoring the optimistic forecast, this chart demonstrates a strong history of organic growth and value creation from both the original and acquired businesses. Specifically, it shows that the pre-2011 cohort of original businesses (and very early acquisitions) continued to deliver good organic growth in the years that followed, with a 13% CAGR over 13 years. Meanwhile the cohort of businesses acquired between 2011 and 2016 then delivered strong further 16% organic growth in the eight years that followed. This is highly impressive, especially given the 12.4x average EV/EBIT multiple that M3 is paying for its deals, according to the analysis I provided above.
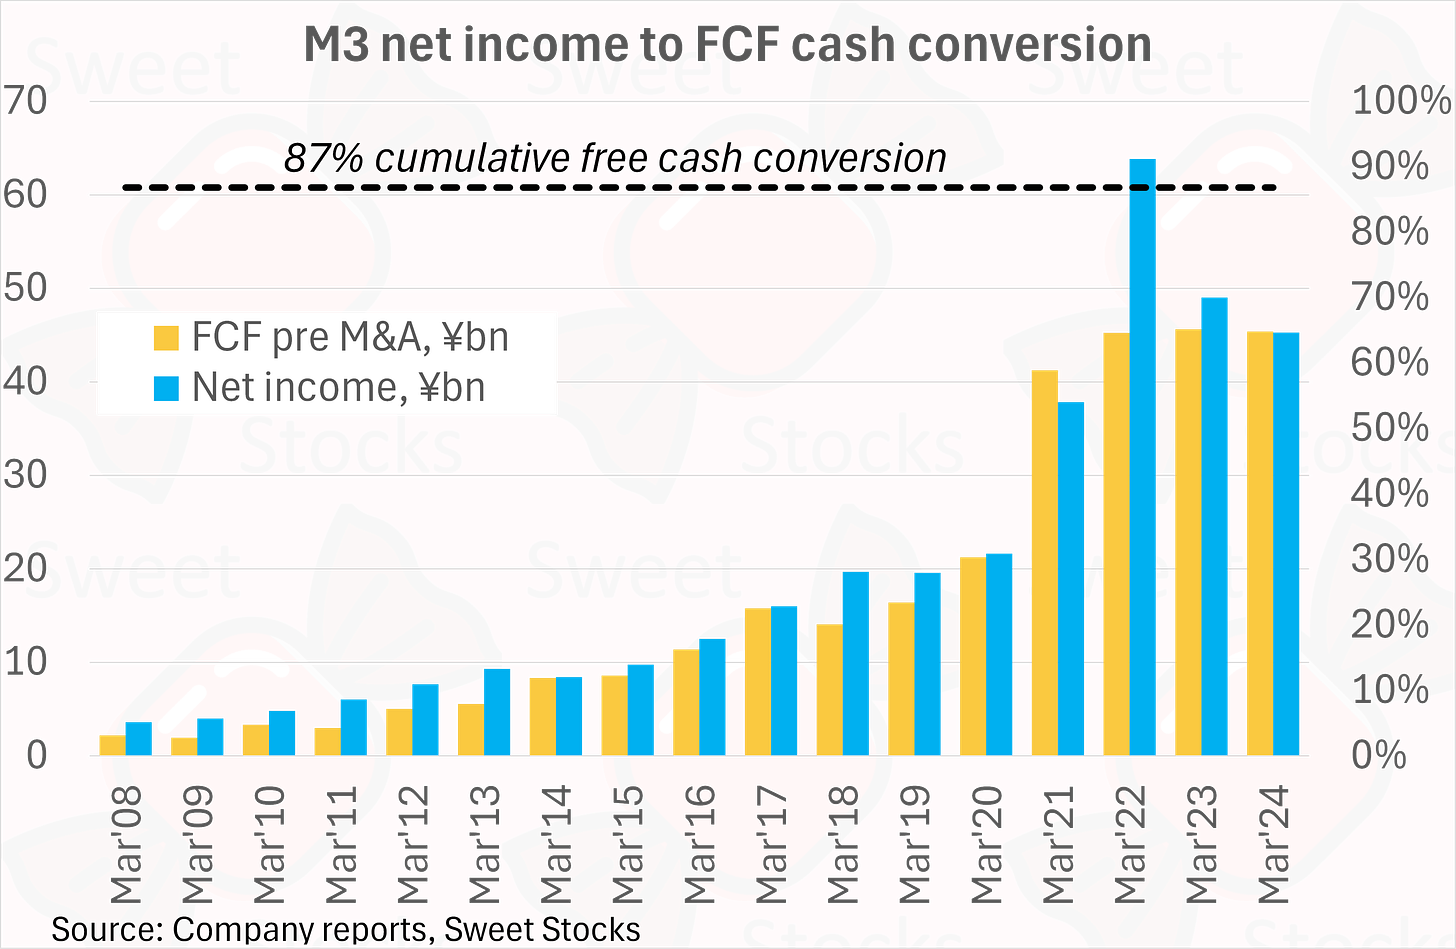
Cash generation is also key in getting comfortable with an acquisitive business like M3. My chart below shows that M3 has an excellent track record of converting net income to free cash flow, before cash outflows on new M&A. The cumulative conversion rate is 87%. (In FY22 M3 booked a non-cash profit on the gain from MedLive’s high-priced IPO. Cash conversion would be in the mid 90s without this.)
M3’s capital allocation includes a dividend payout in the 20-30% range. In the period from FY08 to FY24 inclusive, Y64bn of total dividends were paid out, while Y120bn was spent on M&A. The remaining Y110bn of cumulative free cash flow was hoarded, as M3 built up a large net cash balance that stood at Y131bn at March 2024. This will soon be deployed, if the larger-scale M&A deals such as the proposed Benefit One deal and the completed Elan deal are a guide.
Return on invested capital is the acid test of value creation. M3’s ROIC was 13% in the most recent year. While the trend has been down as the balance sheet has grown, M3 continues to deliver returns well in excess of its cost of capital.
Estimates and valuation
My estimates are shown in the table below, with comments to follow.
Since 2014 M3 has used IFRS accounting, as is unusual but optional for Japanese companies. This means that goodwill is not amortised as under Japanese GAAP, but rather is tested for impairment every year. As of March 2024, goodwill stood at Y95bn, with other intangible assets at Y51bn. It is mildly reassuring that M3 has taken minimal impairments of goodwill and other intangibles during its ten years of IFRS accounting. The exception was in the most recent Mar’24 year, when they took a Y5.8bn impairment on the US clinical trials business.
Elan will be consolidated with effect from October 21 2024. Its Y45bn of revenue, 23% gross margin, 8% operating margin and 45% minority interest are factored into my FY25E and FY26E forecasts.
I do not factor in any future M&A, despite the fact that M3 will undoubtedly do so. Hence my 7% EPS CAGR reflects only already-completed deals and organic progress, with clear upside expected from future acquisitions.
The obvious fact about M3’s historic valuation is that it got heavily caught up in the 2021-era bubble in quality growth stocks that prevailed worldwide in general and in Japan in particular. (The peak valuation of 150x forward P/E matched the levels at which it traded immediately after IPO when it was tiny.) See chart below.
Today, all of that enthusiasm has unwound, and the current multiple of 22x twelve months forward is extremely sober. In my view, the specific concern of investors that follow the company closely is the falling sales in the marketing support business. Meanwhile, for those not familiar, the combination of an 86% drawdown and a complex roll-up model is scary enough to dis-incentivise further work.
For my part, I regard the current risk-reward as highly attractive. If and when the marketing support business moves back into growth then a substantial re-rating could follow, on top of prospective high-single-digit organic growth and a similar contribution from M&A. Altogether a 20% IRR looks achievable for the next three to four years.








Thanks for actually explaining the business clearly. Never really understood M3 until reading this.
Great report Alex. I especially liked your section on the serial acquirer part. I was initially quite skeptical, but your analysis helped me see that they are more disciplined than I thought! Great value comes from having one's bias corrected :)