NCAB – a near-shoring picks and shovels play
(NCAB.ST, $1.4bn market cap, $0.9m ADVT, 94% free float)
I spoke to NCAB’s CEO, Peter Kruk, in preparing this report. All opinions and estimates are solely my own responsibility. Feedback is welcome as always.
NCAB is a printed circuit board supplier that owns no factories. It acts as a bridge between its equipment-maker customers in the west and the PCB manufacturers in the far east.
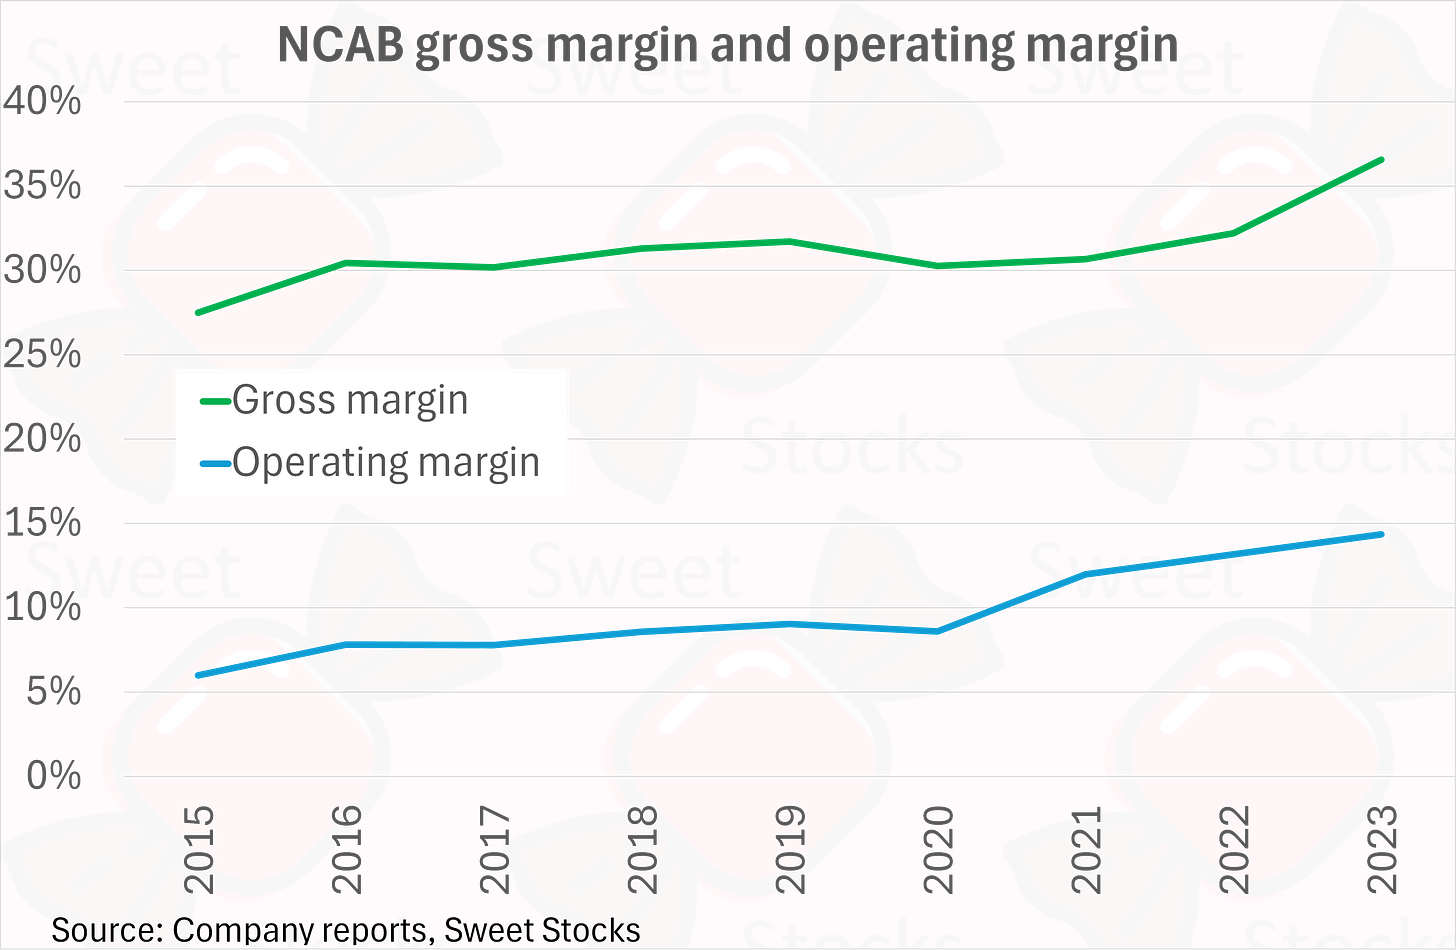
NCAB adds significant value to both sets of partners, for which it is paid a respectable >35% gross margin. Thanks to its asset-light model, this translates into a healthy >20% ROIC.
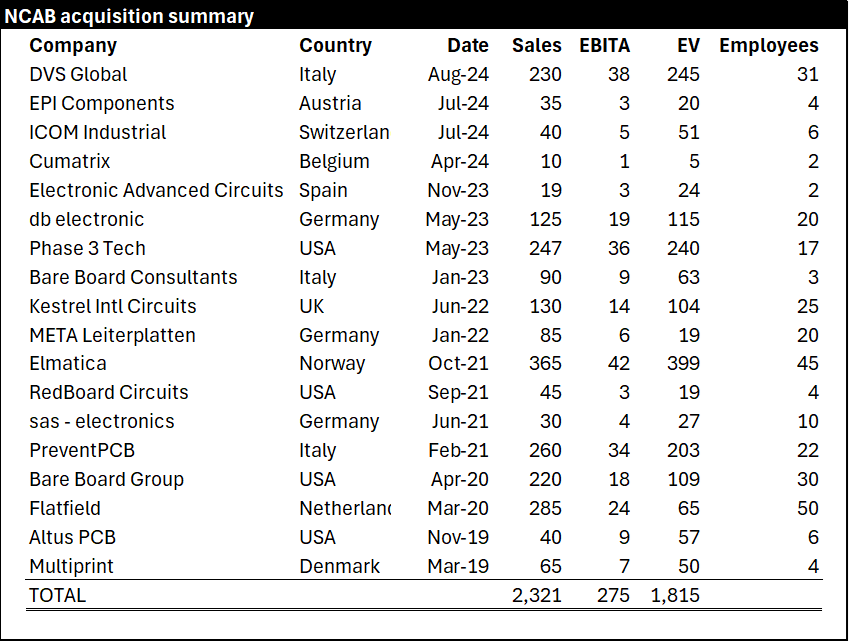
M&A provides an attractive reinvestment opportunity, given the fragmented competitive landscape and the stickiness of customer relationships in the industry. NCAB has completed 18 bolt-on acquisitions since its 2018 IPO.
A destocking cycle has slashed volumes and prices since the 2022 peak. If and when organic growth returns, NCAB could enjoy a sharp rebound.
Valuation depends on tricky normalisation work on both sales and margins. I have not yet started a position in NCAB, but I am keeping it high up my watchlist thanks to its quality growth profile and its leadership in a defensible niche. Thoughts on how to time the opportunity are welcome.
What is a printed circuit board?
NCAB sells the bare green circuit board, patterned and with holes drilled, but before all the chips, resistors, capacitors and other components are mounted on it to make a fully functioning device.
This is not cutting edge technology. The PCB industry is low-cost, commoditised and highly competitive, while also being capital-intensive and cyclical. PCB maker stocks have generally been regarded as poor investments for decades.
Yet every end-product requires a custom-designed board for its specific bill of materials and layout. Quality has to be perfect: a good PCB can’t make a product better, but a defective PCB will cause the whole machine to fail. As well as simple two-layer and four-layer boards, there are multilayer boards, HDI boards, flexible and rigid-flex boards, and IMS (aluminium) boards, with different factories specialised in each kind.
This combination of factors – dull and low-priced, yet fiddly and complex – makes PCB procurement a headache that NCAB is paid to solve.
Customers
NCAB addresses what it calls the high-mix, low-volume (HMLV) segment of the market. The total global PCB market is worth around $80bn. Most of this is for high-volume applications such as consumer electronics and automotive, procured directly. This leaves around $25bn of HMLV demand for NCAB to target as an intermediary.
NCAB has 3,650 customers. They are niche equipment makers and their electronics manufacturing services partners. Thousands of firms across medical, automotive, energy, telecom, defence, and all manner of industrial niches need customised PCBs for their high-end, limited-volume machines. Diversification is good, with the top ten customers accounting for just 24% of sales. The splits by sector and by customer concentration are shown below.
The regional and country split is as below.
With an average invoice of just $2,500, direct procurement of the PCBs is not viable for these customers. They lack the necessary scale and expertise to choose the right factory, negotiate a good price, and ensure quality and on-time delivery.
NCAB solves these problems. Its expert local sales staff can check and amend the customer’s PCB design, advise the right product solution, recommend a factory, chase to ensure successful delivery, and generally hold the customer’s hand along the way.
In a third of cases, NCAB helps to optimise the customer’s design, typically via a production review where it can suggest a more robust and cost-effective layout.
Geography has a key role to play. The reshoring and nearshoring trends mean that high-value equipment is increasingly being assembled close to home, in Europe and America. Dozens of local EMS firms are on hand to facilitate this. But the bare boards themselves still need to be procured from the far east, where almost all the factories are.
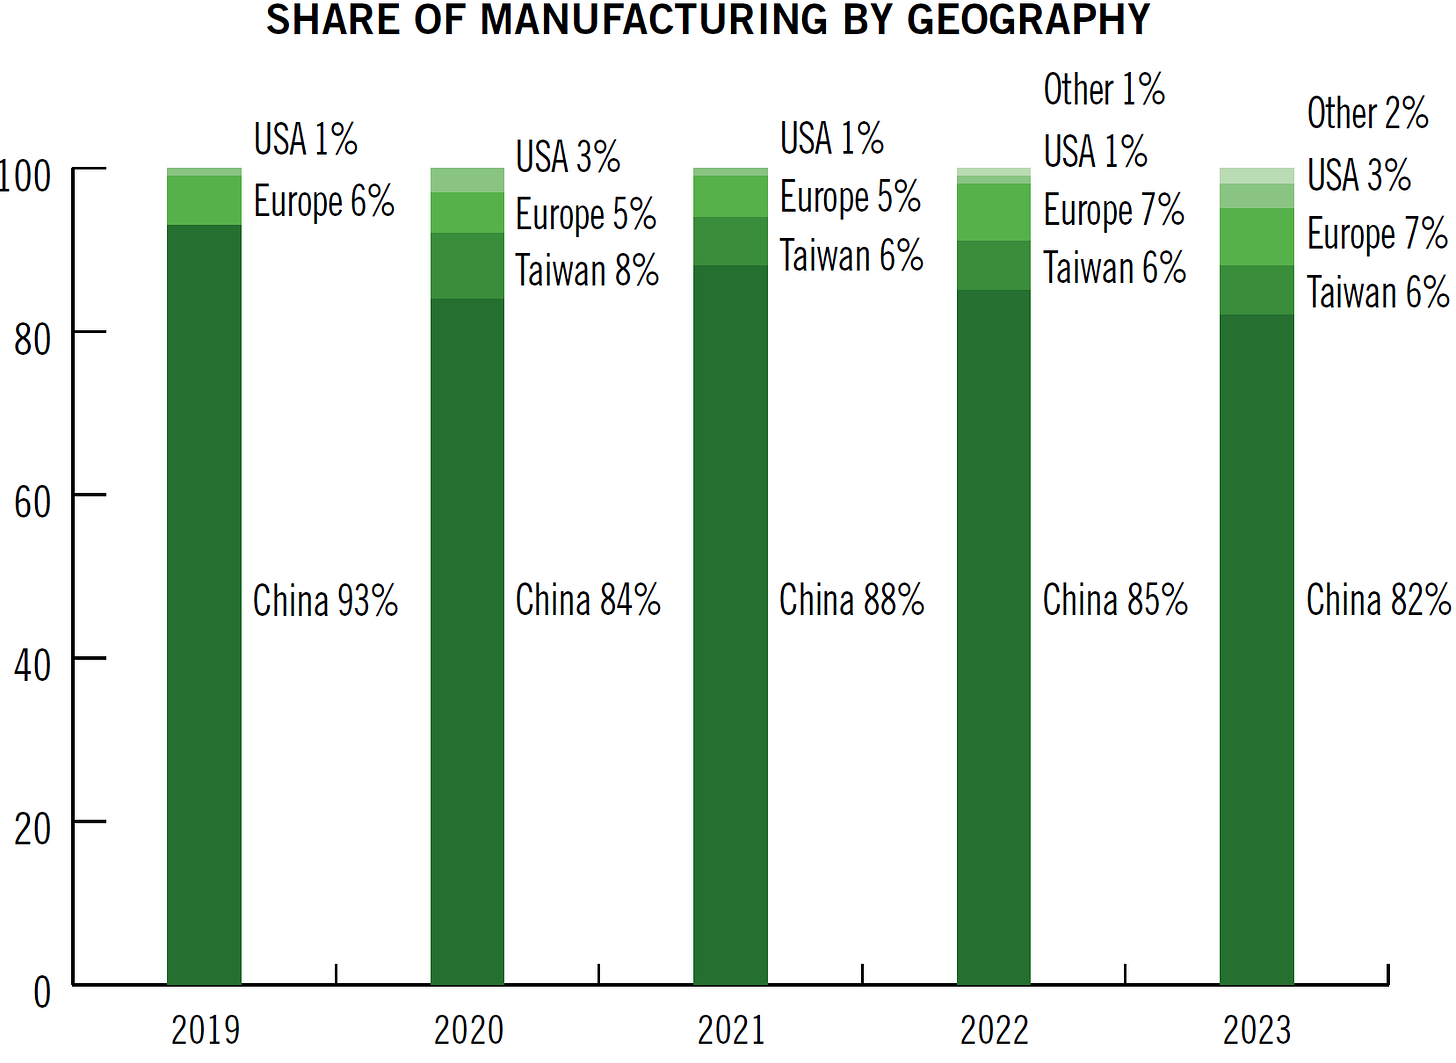
95% of NCAB’s shipments go to Europe and America, while 88% of the manufacturing is done in China and Taiwan. See chart below for the gradual reduction in share from China, which still makes the vast majority of PCBs.
The transcontinental distance forms a major barrier that impedes direct commerce, and creates space for NCAB to add value by bridging the language, cultural and physical divides. (Most orders are air freighted, which NCAB procures far more economically than its customers could manage.)
NCAB has a 110-strong factory management team, permanently based in China and Taiwan, whose task is to select, train and monitor the partner factories to ensure reliable quality and delivery. NCAB carries out its own quality audits on all its partner factories.
NCAB concentrates its purchasing on 32 main PCB factories, out of the >2,000 total possibilities. NCAB’s aggregated volume makes it an important customer of these producers, giving it clout to obtain preferential treatment on behalf of its customers.
Market share and competitors
NCAB is the biggest PCB trader, though it is still tiny compared to the estimated $25bn potential size of the HMLV market. It has an implied 2% market share globally, which can be analysed as c8% in Europe, c2% in America and close to zero in Asia.
It has three notable global competitors with a similar value-added model, profiled below
· ICAPE is a French firm that listed in mid 2022 under the ticker ALICA.PA. It has a market cap of $88m and trailing revenue of $198m. (With a float of just 44% and an ADVT of just $16k, it is utterly illiquid.) Profitability is weak with a 5% operating margin. Its strategic positioning is slightly confused by ownership of some small PCB factories. This is a red line for a broker, as it introduces mixed incentives to push customers’ volume into the owned factory, even if others would be better suited.
· Fineline of Germany is a privately held PCB broker that gradually changed ownership over the last ten years from Israeli owners to Fastprint, a Chinese PCB manufacturer that is listed in Shenzhen under ticker 002436.SZ with a $2.2bn market cap. This interview from Oct’17 gives a great flavour of Fineline’s similar worldview to NCAB at that time, when they were 75% owned by Fastprint but still managed with a high degree of independence. Since then, Fastprint has exerted greater control and has re-oriented Fineline to be a price-led competitor. It has 350 employees, implying a smaller scale than NCAB with its 605 staff.
· PalPilot is a private Californian firm with a similar model to NCAB. This profile mentions “8 to 10 new projects per day” and “35 experienced designers” to help customers with PCB design.
In addition, there are many dozens of small trading companies across Europe and the US without their own presence in Asia. Among these are the potential M&A targets for NCAB.
Other competition comes from PCB manufacturers who adopt a hybrid model to seek HMLV orders directly from European and/or American customers. STARTEAM (fka CML) is an example, with $218m revenue from own factories in China and Thailand, plus sales offices in Europe and America. It mainly serves the high-volume automotive market, but could also seek HMLV orders at the margin.
History, ownership and management
NCAB was founded in 1993 as a basic trader of PCBs. In 2006 the current factory management organisation was put in place, which improved quality and delivery.
R12 became the new major owner from 2007. NCAB expanded beyond the Nordics to the rest of Europe via greenfield expansions. In 2012 and 2014 NCAB moved into the US with two acquisitions. The IPO took place in June 2018, followed by a ramp up of bolt on acquisitions from 2019 and on.
After IPO, the free float was 60%. It has increased to 94% as the pre-IPO owners have gradually exited. R12 sold their final 11% stake a year ago in September 2023.
The chairman, Christian Salamon, has been in post since 2007. He currently holds a 2.1% personal stake, down from 8.7% immediately prior to IPO.
NCAB’s CEO, Peter Kruk, joined in mid 2020 from senior executive roles at Dometic and Stoneridge, where he had been a customer of NCAB’s. He replaced the long-serving previous CEO Hans Ståhl, who had virtually served as NCAB’s founder since 2003. Ståhl remains on the board as a non-executive director, and retains a >2% stake.
The final change of the old guard is taking place right now. Anders Forsén is retiring as CFO after 16 years, replaced by Tim Benjamin from Sandvik.
Overall, the complete rotation of shareholders and management since IPO has been smoothly handled.
Financial development and the current cycle
Sales compounded at a brisk 17% from 2008 to 2023. See my chart below.
Profitability grew at a much faster 28% rate over the same period, as the operating margin expanded from c.4% to 14%. See chart below.
Interestingly, gross margin expansion was the key driver, more than operating leverage – see my chart below. (The full financial track record period only dates back to 2015.)
What caused the most recent gross margin jump from 30% to 37%, and is it sustainable? This is a crucial question.
In management’s view, this was the natural result of the whipsawing price volatility of the last three years. First, when PCB prices spiked in 2021-22, NCAB’s sales staff made efforts to capture the same percentage gross margin as before, with higher gross margin dollars. Then, when PCB factory pricing slumped back down in 2023, the focus switched to passing on lower prices to customers but also trying to retain the same gross margin dollars where possible. This resulted in a higher percentage margin of the lowered price. NCAB believe the gross margin is roughly sustainable at the current level, or perhaps a couple of points lower if prices rise again.
My interpretation is that NCAB may previously have been under-pricing the considerable value that they add to both their customers and their suppliers.
Switching to a quarterly view, my chart below shows the post-COVID explosion in orders and sales, followed from 2022 by a painful period of digestion.
Several factors combined to cause the Covid spike. NCAB’s customers saw actual demand rise. At the same time, component shortages triggered inflationary price rises and double-ordering behaviour, as customers tried to procure safety stocks in the face of snarled supply chains.
My chart below shows that in organic USD terms, sales have been falling by double-digits for seven straight quarters. (Currency volatility during the period means the SEK and USD charts tell somewhat different stories.)
Orders precede sales by roughly a quarter or two. The picture below is more cheerful, with a return to order growth looking imminent.
Many of NCAB’s key EMS customers are listed, as are the major PCB manufacturers. These provide points of comparison for how the cycle is developing.
Four major Taiwanese-listed PCB makers with manufacturing in China are Zhen Ding (4958.TW, $4bn), Unimicron (3037.TW, $8bn), Compeq (2313.TW, $3bn) and Tripod Tech (3044.TW, $3.4bn). Their revenues all peaked in the second half of 2022, as shown in my chart below. This is consistent with NCAB’s sales peak in Q3’22.
Looking instead at the unsmoothed yoy growth rates for each month, we see that the four Taiwanese firms returned to sales growth in either Q4 of 2023 or Q1 of 2024. They are currently all growing at a double-digit rate, unlike NCAB which still saw a double-digit sales fall in Q2 of 2024.
This discrepancy bears watching carefully. I suspect that NCAB’s heavy exposure to Europe is slowing its recovery. Destocking may also take longer for NCAB and its customers, given more steps in the chain, compared to the direct high-volume consumer and auto business that dominates for the large PCB makers.
We can also compare NCAB to its many EMS customers. Kitron of Norway (KIT.OL, $654m) and Note of Sweden (NOTE.ST, $381m) are representative, and nice businesses in their own right. They each work as contract assembly partners for dozens of NCAB’s end-customers. They use automated surface mounter machines (often supplied by Fuji Corp, 6134.T, $1.5bn) to affix the chips and components on to the bare board. They sometimes also complete the final box build.
The three-way relationship between the end-customer, its EMS assembly partner and NCAB as the PCB supplier should be a strong one. Around 60% of NCAB’s total sales are invoiced to its many EMS customers, although the end-customer may have an involvement in approving NCAB as the PCB supplier.
My chart below shows that NCAB’s revenue has lagged behind Kitron’s and Note’s since the late 2022 cycle peak. This might reflect the especially severe pricing slump seen in PCBs, which are only a small percentage of total cost for the EMS firms.
The M&A strategy
NCAB’s free cash generation has totalled SEK1.5bn since IPO. They have reinvested all of this into SEK1.6bn spent on M&A. See my chart below.
My table below details the eighteen deals completed since IPO. In aggregate, NCAB was able to buy a 12% margin group of companies at below 1x sales. This is an attractive equation.
It gets better after acquisition. NCAB’s integration programme is able to deliver real synergies. They can improve gross margin thanks to NCAB’s superior factory and logistics rates. More importantly, NCAB finds that it can typically grow sales at the acquired companies by offering higher quality service, as well as access to its broader factory panel and product range.
As a caveat to this, NCAB has sometimes needed to shed a portion of low value added business after acquisition, if it doesn’t align with their service and margin aspirations. This was especially an issue when NCAB first entered the USA, where the initial acquisitions back in 2012 and 2014 took a long time to bed in and bear fruit.
Debt is moderate at 1.1x EBITDA as of June 2024. NCAB has scope to continue with the current heady pace of acquisitions, if counterparties continue to be willing to sell. (Deal timing is not in NCAB’s sole control, given lengthy courtships.)
Return on invested capital will likely sustain at around 20%, as NCAB continues to earn an attractive return on the growing balance sheet.
Estimates and valuation
This is where I struggle. I project a high-single-digit sales recovery for NCAB in each of the next three years. I also forecast a gross margin and an operating margin that stay higher than ever imagined prior to 2022. And yet my estimates lag a ways behind consensus, and leave the stock on a punchy 30x 2026E multiple. See table below.
Of course sales could rebound at a 15% to 20% CAGR. EBITA margin could shoot to a new high with operational gearing. Further accretive M&A could be delivered. These are the ways in which I could turn out to be far too cautious, and the stock a screaming buy. A high multiple would certainly be awarded for such a development.
(The stock has historically traded everywhere from 12x to 55x, as its highly attractive model was first discovered and then over-enthused, before the cycle broke down. See chart below.)
Lacking the conviction to believe the rosy scenario, I will keep NCAB on my watchlist and look for an opportunity to buy a bit cheaper.


Excellent write up.
It looks like a great company, but possibly at the wrong price.
For a company with a net margin that seems to have peaked under 10%, having an enterprise value at 3.86x LTM top line revenue looks rich. The business would need to see rapid top line growth to justify such a premium yet revenue has been flat to declining in recent years. So I am struggling to see the justification for the premium.
I note in the analysis that you have a chart (NCAB Order Intake and Sales) which plots orders against sales. This clearly shows little sales growth for the past two years following the Covid spike, and you anticipate revenue growth to return. But is there not an alternative scenario? Could it not be that sales were pulled forward in the aftermath of Covid and that they will normalize to pre-Covid levels marking a softening in the top line?
The other question that arose in my mind related to the change of management over the past few years which you explained very nicely. But there seems to be a different approach with the new guard. The payout ratio has jumped to over 60% whereas in the past it averaged closer to 25%. This suggests that the old crew were focused on growth through the reinvestment of earnings as their priority, whereas the new leadership has prioritized the distribution of earnings over all else. This may indicate that the stock is transitioning from a growth equity, to something that more closely resembles a fixed income instrument (with considerable downside capital risk attached). However, given what appears to be an over inflated market capitalization, even with a 60+% payout ratio, the yield is only 1.5%.
Based on the above, I wouldn't invest at these levels. Having them on a watch list is a very sensible approach for now and I may look again following a price correction or a significant change in the unit economics. Either the price needs to come back down in line with the fundamentals, or else the fundamentals need to catch up with the market cap.
How can we buy this stock if we’re not based in Sweden? Is it listed on the US stock exchanges?