Casey’s sells fuel, groceries and fresh pizza across the US Midwest from 2,600 stores and rising. The well-executed buy-and-build rollout strategy has yielded excellent returns for long-term shareholders to date. Plentiful white space suggests decades of further growth ahead.
A surprising step change in fuel margins has juiced profits since FY21. Future returns will depend on whether high fuel margins are sustainable. The answer is directly connected to the fragmented industry structure, in a pleasing example of Economics 101 in action.
Spoiler alert: after my initial work I stay on the fence. I bought a starter position but have not yet backed up the truck at today’s price. I’ll be following the company with interest.
I’d welcome any thoughts from those who know Casey’s or the sector, either on the underlying quality or on how to time the opportunity.
Background and business model
The US equity market is the world’s deepest when it comes to both number and quality of listed companies. The top 500 names by market cap are all over $20bn, and the next 2,000 are sized anywhere from $900m to $20bn. Amid the usual small-cap duds and plodders are many businesses with outstanding track records and management teams laser-focused on further value-creating growth.
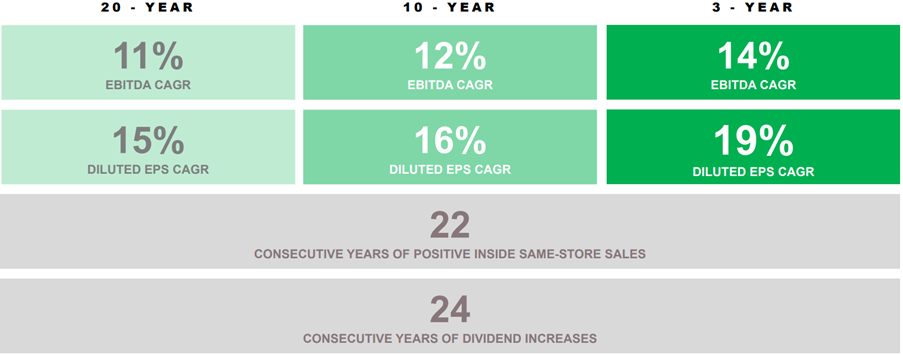
Cue Casey’s General Stores. At the time of writing it ranks #785 of US stocks with a $10.6bn market cap. Since its IPO in 1983 the company has spent 40 years compounding sales and profits at double-digit rates (see below), sustaining a high level of reinvestment at satisfactory returns on invested capital. I came across it only recently when screening for quality US names.
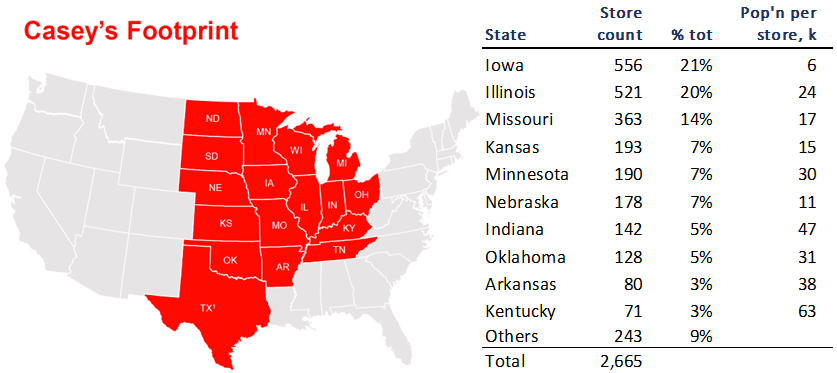
Casey’s sells gasoline, groceries and prepared foods. Its store network majors on small towns and rural locations in Iowa, Illinois, Missouri and neighbouring flyover states. Famous for clean bathrooms and fresh pizza, the stores feature some 3,000 square feet of sales area plus a kitchen, allowing for a broader and more attractive offer than independents can manage.
Founded in rural Iowa in 1968, Casey’s reached 304 stores by 1981, when it launched its pizza program. It hit the 1,000 store milestone in 1996 and 2,000 in 2017.
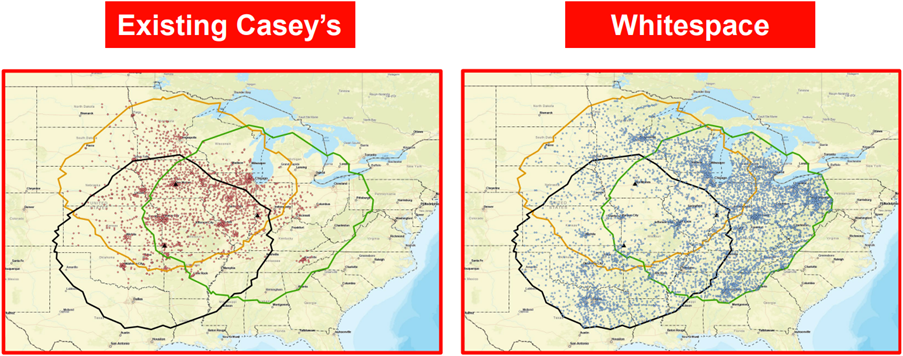
Casey’s has a self-distribution model, with three distribution centres and a fleet of 400 tractors for grocery and fuel distribution. The original distribution centre in Ankeny, Iowa is complemented by DCs in Terre Haute, Indiana (Feb’16) and in Joplin, Missouri (Apr’21). These increased Casey’s geographic reach, given management’s strategy to open stores within 500 truck miles of a distribution centre. The maps below show the existing stores and the potential catchment areas.
Casey’s prides itself on its ability to trade in towns as small as 500 people, with half of stores in towns of 5,000 or fewer. Often Casey’s may be the only food option in the neighbourhood. The strategy is a more extreme version of Dollar General’s preference for towns with populations of less than 20,000. (Dollar stores would be part of the broader competitor set for Casey’s, as they sell tobacco, alcohol and groceries, but with limited fresh foods.)
Management
Casey’s has enjoyed stable and capable leadership. Darren Rebelez was recruited as CEO in 2019 from outside the company, having served as IHOP president and most notably as 7-Eleven COO for seven years. He was further named as Board Chair in June 2023, affirming his intent to lead for many more years. As CEO he succeeded Terry Handley, who retired after a 38-year career with Casey’s, serving as COO since 2006 and president since 2014. Continuity has been a strong point, with founder Don Lamberti retiring in 2003 and profitable growth accelerating since then.
Casey’s strong culture emphasises humility and collegiality. They speak thoughtfully about how to preserve this culture as they expand, for example by ensuring that Casey’s veterans are placed as supervisors within newly entered regions.
Growth, capital allocation and ROIC
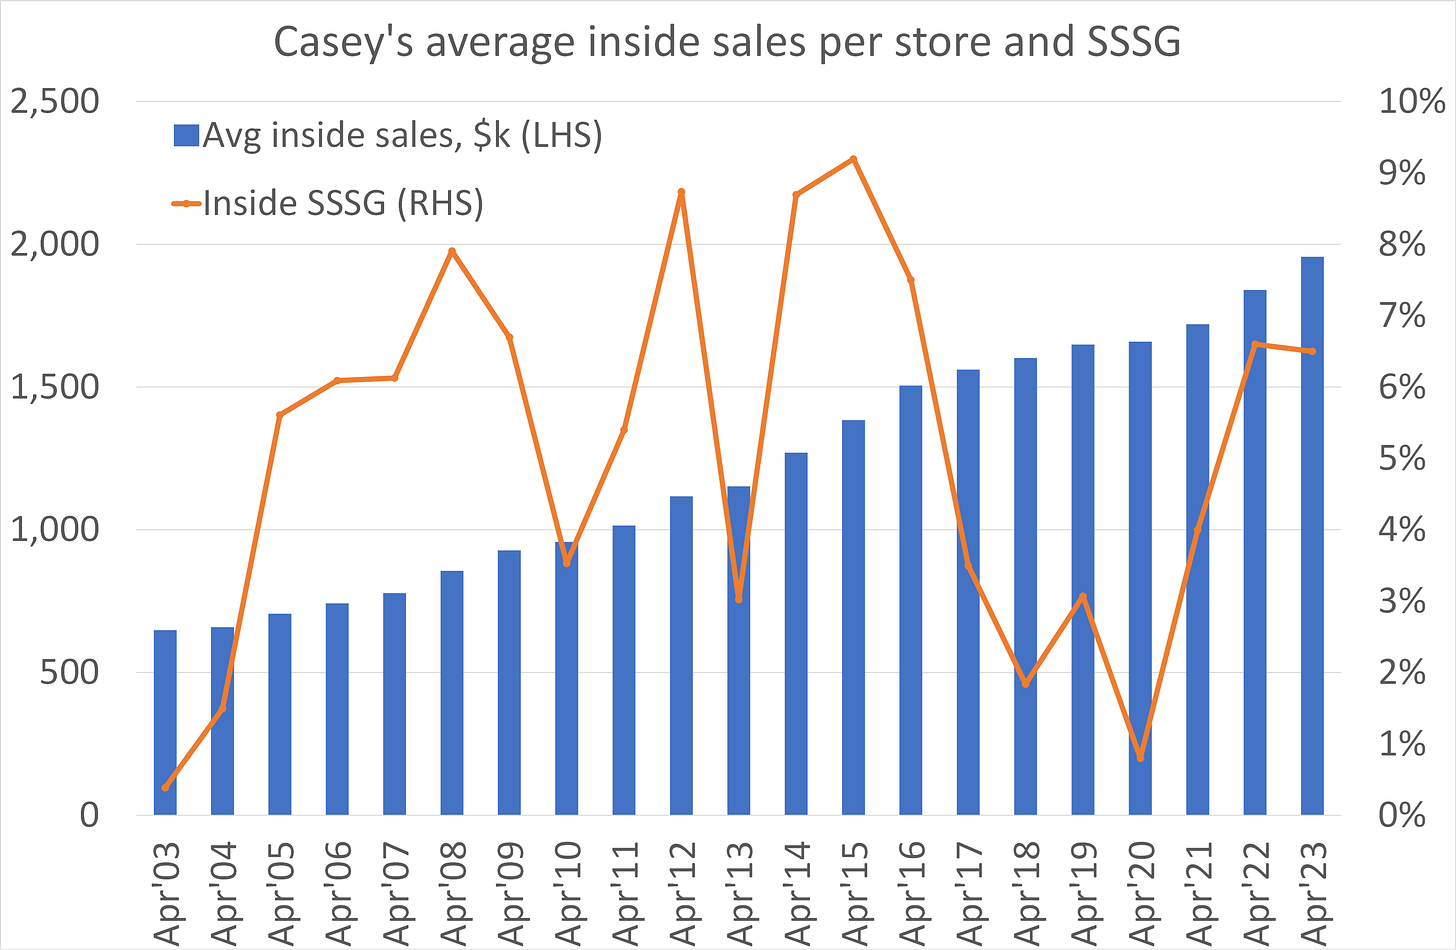
Same store sales growth has been impressive. My chart below shows 21 consecutive years of positive inside same-store sales growth (grocery and prepared foods combined). The cumulative same-store growth is significantly stronger than Walmart over the same period.
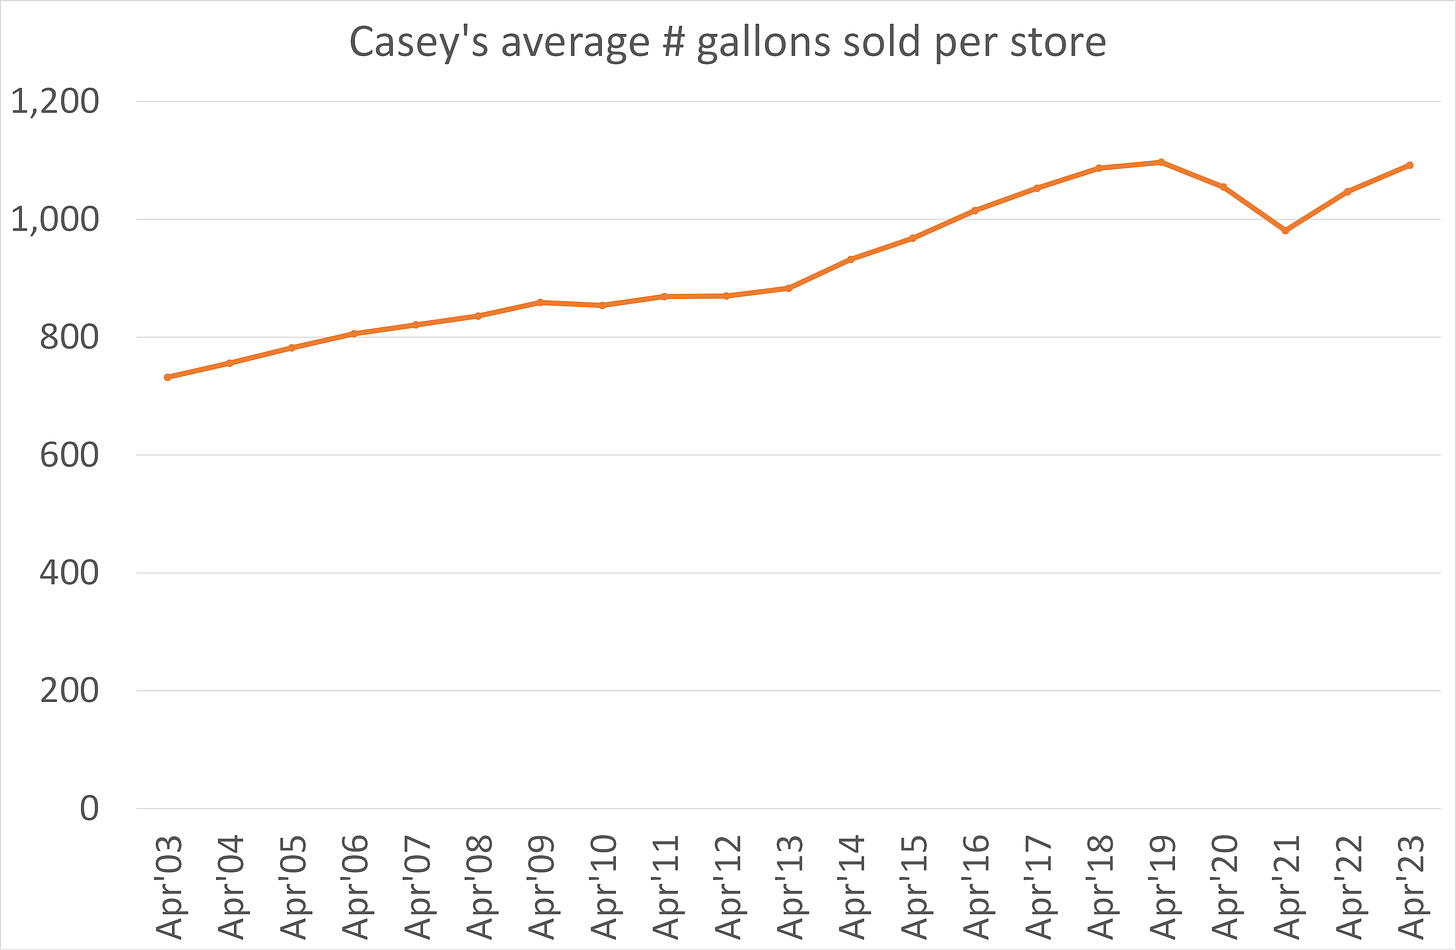
Casey’s has also increased its fuel sales per store over the period, albeit with a lull in the early 2010s and a fall during the pandemic.
This like-for-like growth shows Casey’s advantaged format is steadily winning market share. Convenience industry growth has been closer to flat over the decades.
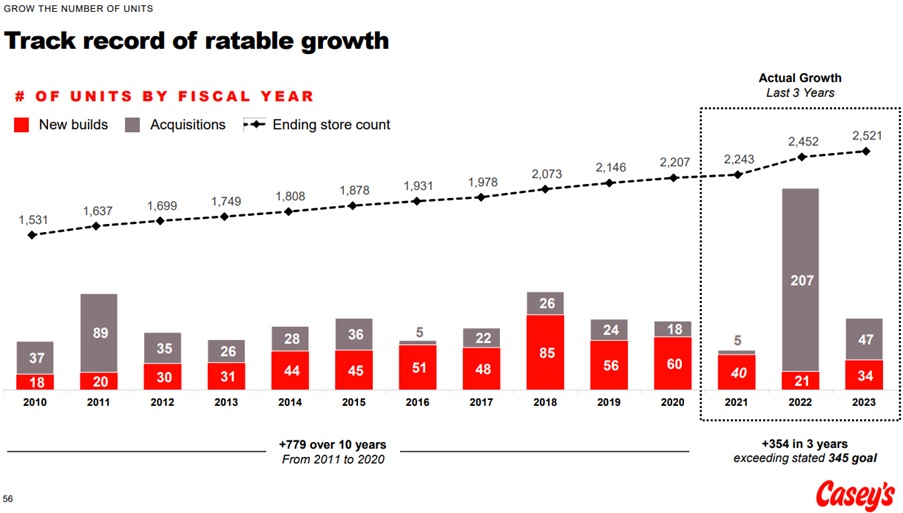
Casey’s has also been active in growing its store count. Unit growth has averaged around 4% for the last two decades, including both new builds and acquisitions. (See chart below from the comprehensive 2023 Investor Day deck.)
Casey’s owns the freeholds on most stores. After the recent jump in construction costs, acquisitions work out cheaper per unit than new builds. Casey’s expects to pay 6-9x trailing EBITDA. Crucially, Casey’s finds that by investing in the acquired stores, converting them to the Casey’s format and leveling up the food offer, they can increase EBITDA by c.70% post remodel.
In August 2023 Casey’s agreed to buy 63 stores in Kentucky and Tennessee from EG Group. In November 2023 they completed a 22-store acquisition in Texas. These are typical examples of the small chain acquisitions that Casey’s can make.
As should be clear, Casey’s model is asset-intensive. The growth program has been self-funded from cash flow, and has been the main use of capital, with the dividend payout ratio typically below 20% and limited share repurchases in the last decade. Accumulated capex has exceeded $4bn over the last ten years, with over 75% of this oriented to growth. (This includes capex to fund Casey’s additional distribution centres and owned fleet of trucks and fuel tankers, according to its self-distribution model.) M&A spend was another $1.2bn.
Has the company created value with this large re-investment?
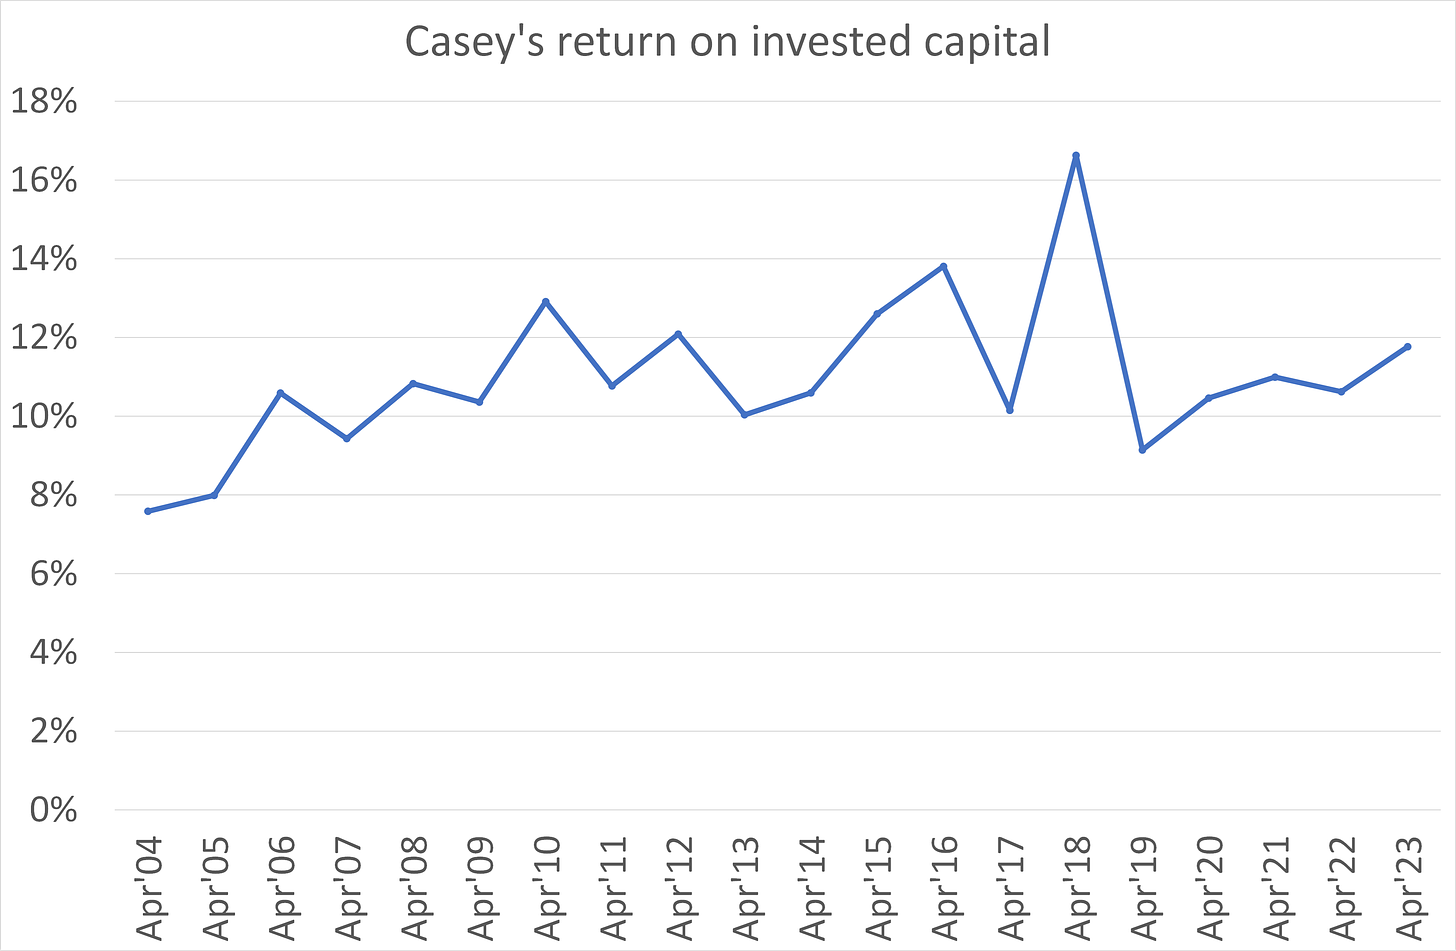
Happily, the answer is yes. ROIC has stayed in double-digit territory (see chart), well above the WACC which the company conservatively estimates at around 7.5%. The company uses a 15% hurdle rate for new investments by steady state in year 5-6. The 10-12% ROIC is not spectacular, but it is satisfactory given the proven nature of the rollout and the counter-cyclical character of staples retail.
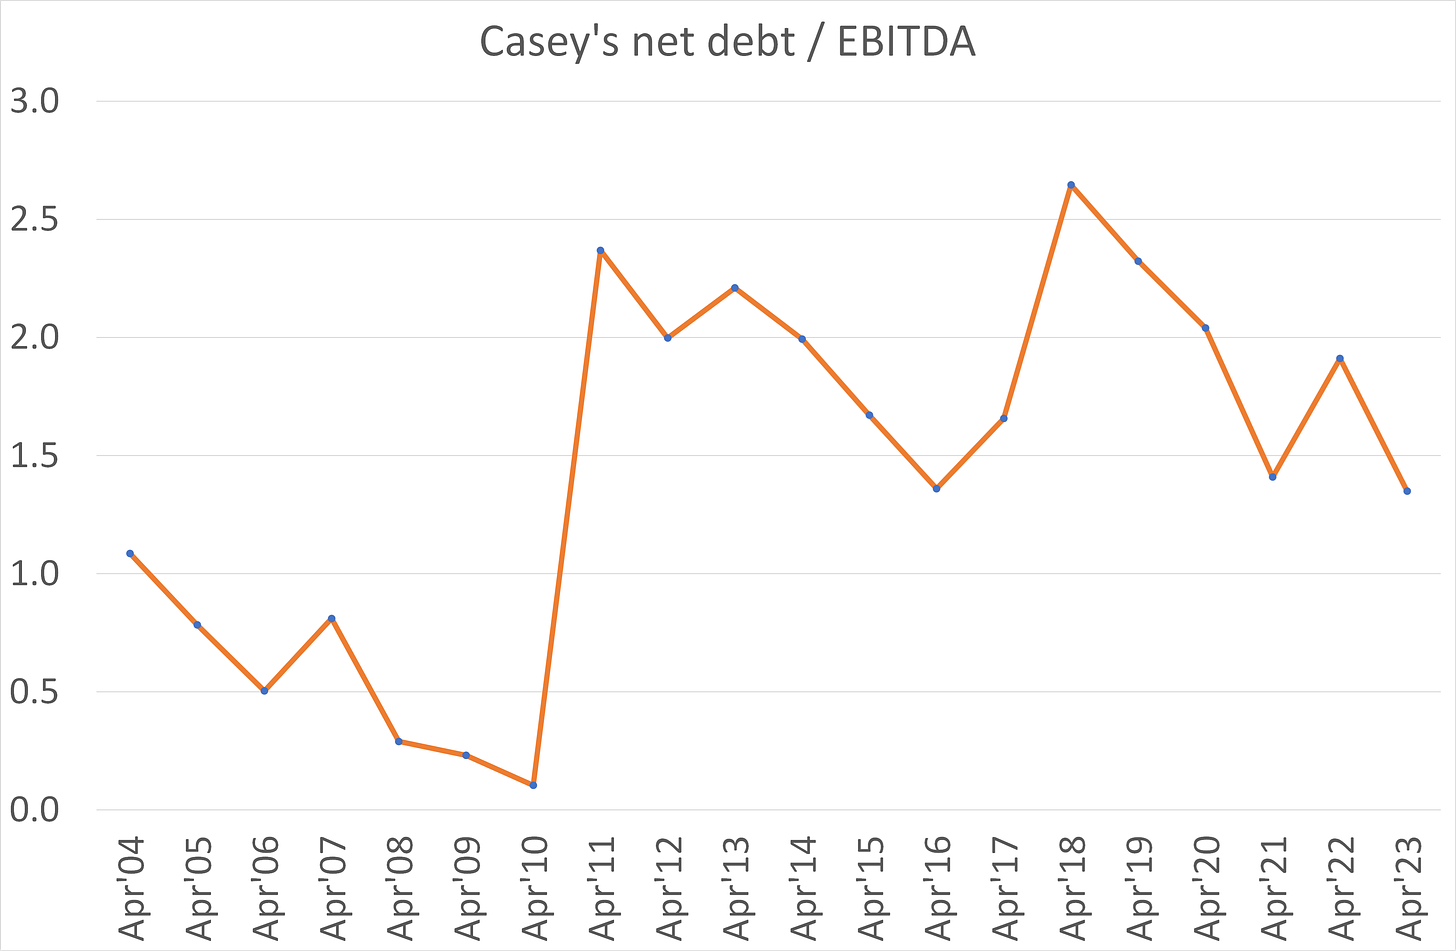
In balance sheet terms, Casey’s targets gearing of 2x debt to EBITDA at steady state. As per my chart, the company has stayed around this level for the last 12 years. It is willing to go higher for attractive M&A, and prepared to buy back stock if leverage remains far below 2x. (Buybacks will total $100m in FY24.)
Prior to 2010, the balance sheet was significantly under-geared. In Apr’10 Couche-Tard launched a hostile takeover bid for Casey’s, with a number of cash proposals that were fought by the board and ultimately failed. 7-Eleven entered the fray as a potential white knight but also failed to win the board’s recommendation. Amidst this, the board geared up the balance sheet to fund a $500m Dutch auction-style buyback.
Category mix
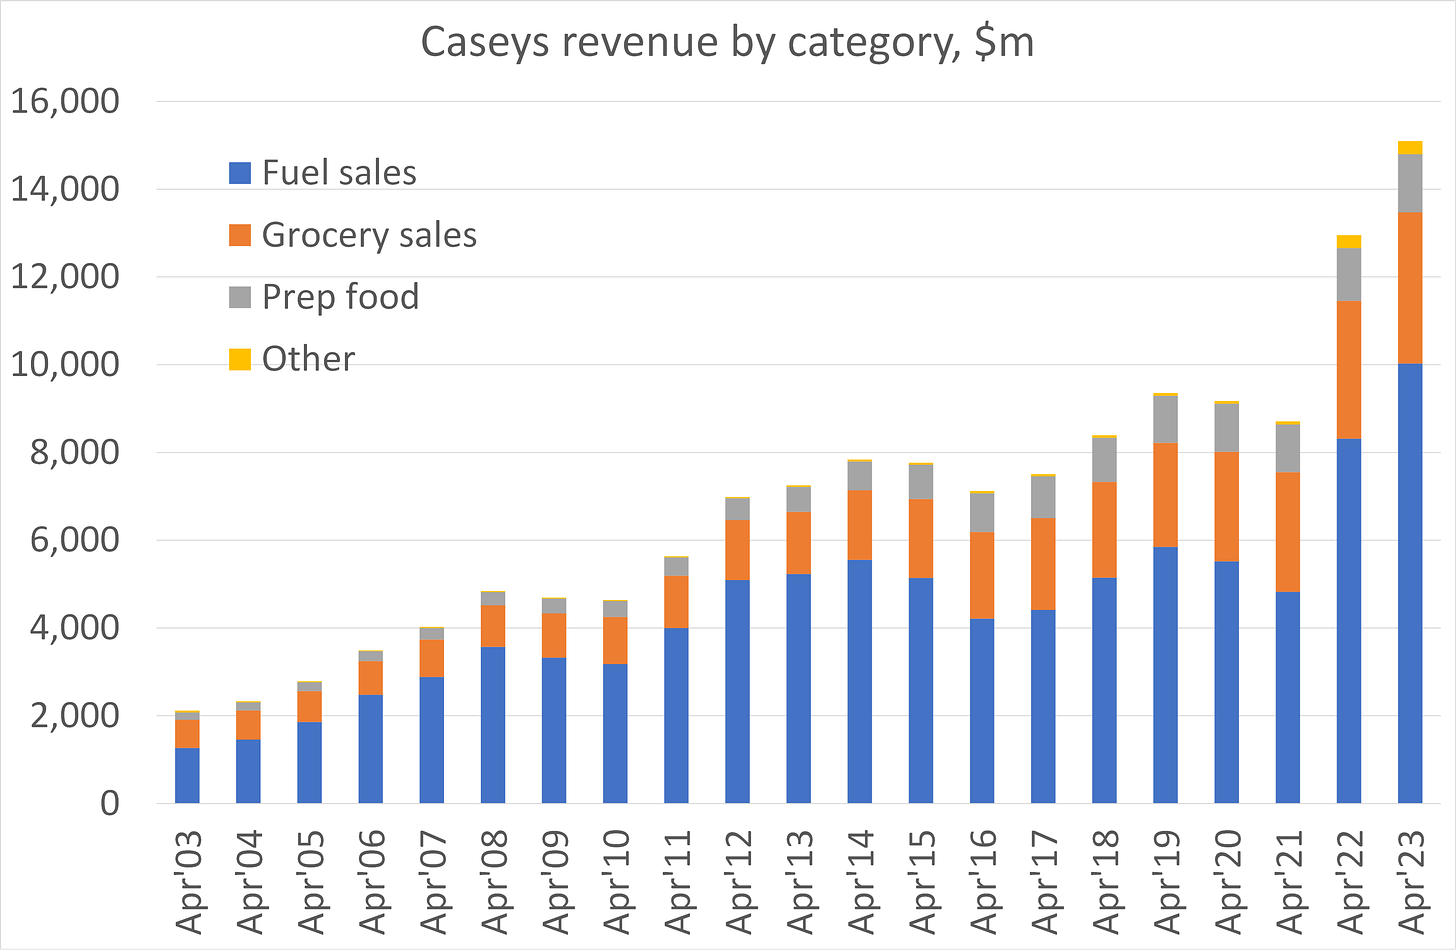
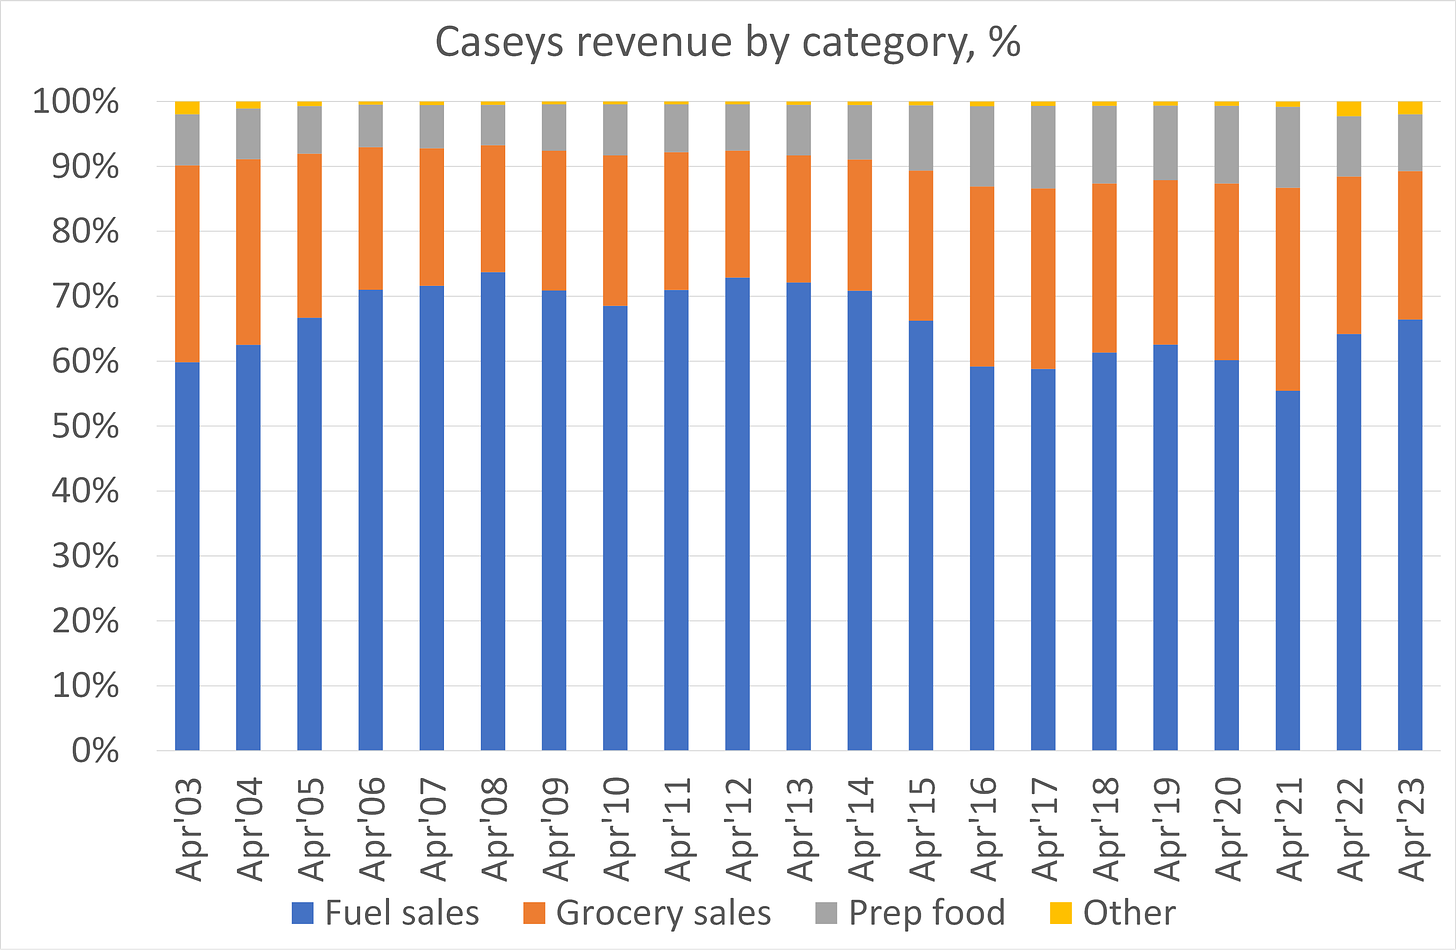
Fuel generally makes up 60-70% of total sales, depending on oil price fluctuations. Groceries make up 20-30% of sales, and freshly prepared food and drinks are just c.10% of the total revenue mix. The two charts below show the absolute sales mix over time, and the percentage split.
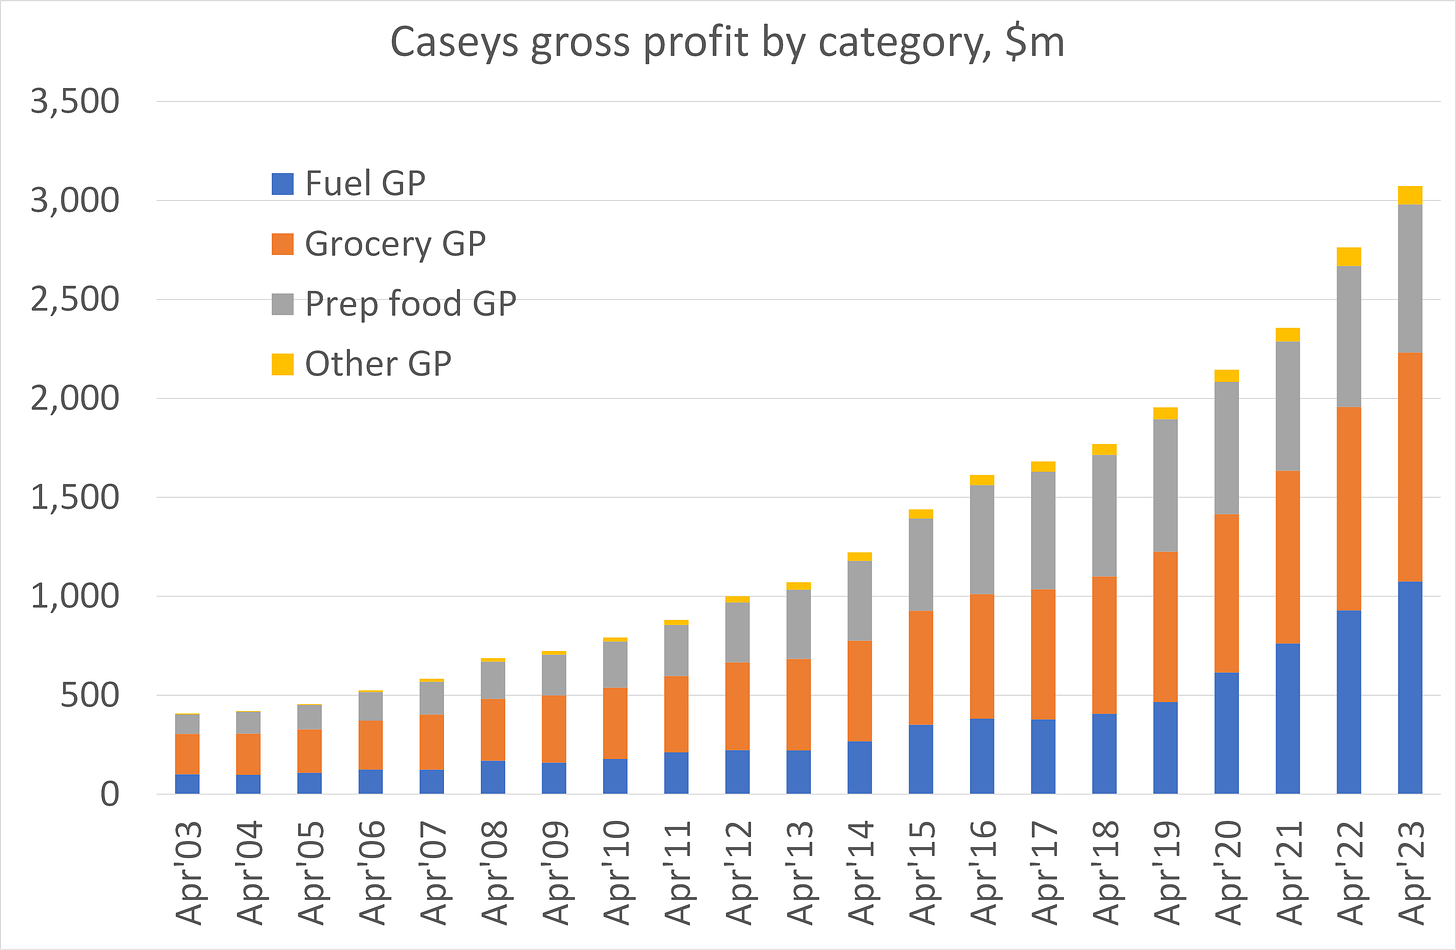
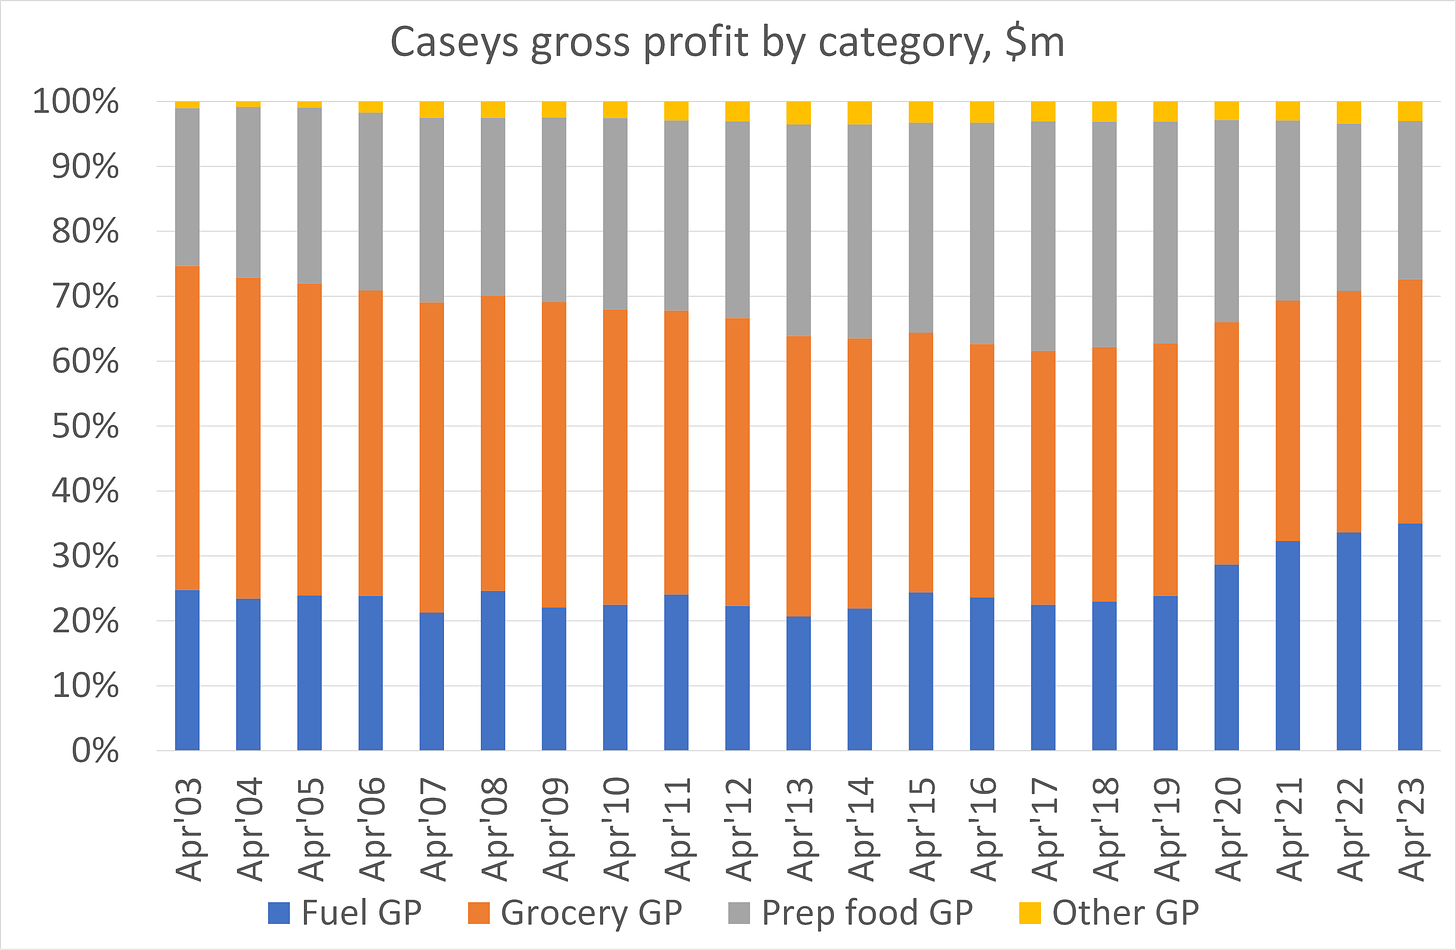
Gross margin varies hugely by category. In FY23 fuel had an 11% GPM, grocery 34% and prepared food 57%. This means that gross profit is evenly balanced across the three main categories, with roughly a third each from fuel, grocery and prepared food.
Note that tobacco and nicotine products (including vapes) contributed 10% to revenue and 9% to gross profit (the average for the three years to FY23). Tobacco is reported within Grocery but carries a narrower gross margin than other Grocery lines. Tobacco has reduced in weight for Casey by 30% over the years, from 13% of total gross profit in the three years to FY06 to 9% now. In the first six months of fiscal 2024, management has pointed to a further sharp fall in cigarette volume across the industry, as seen in Altria and British American Tobacco results.
Fuel margin jump and industry structure
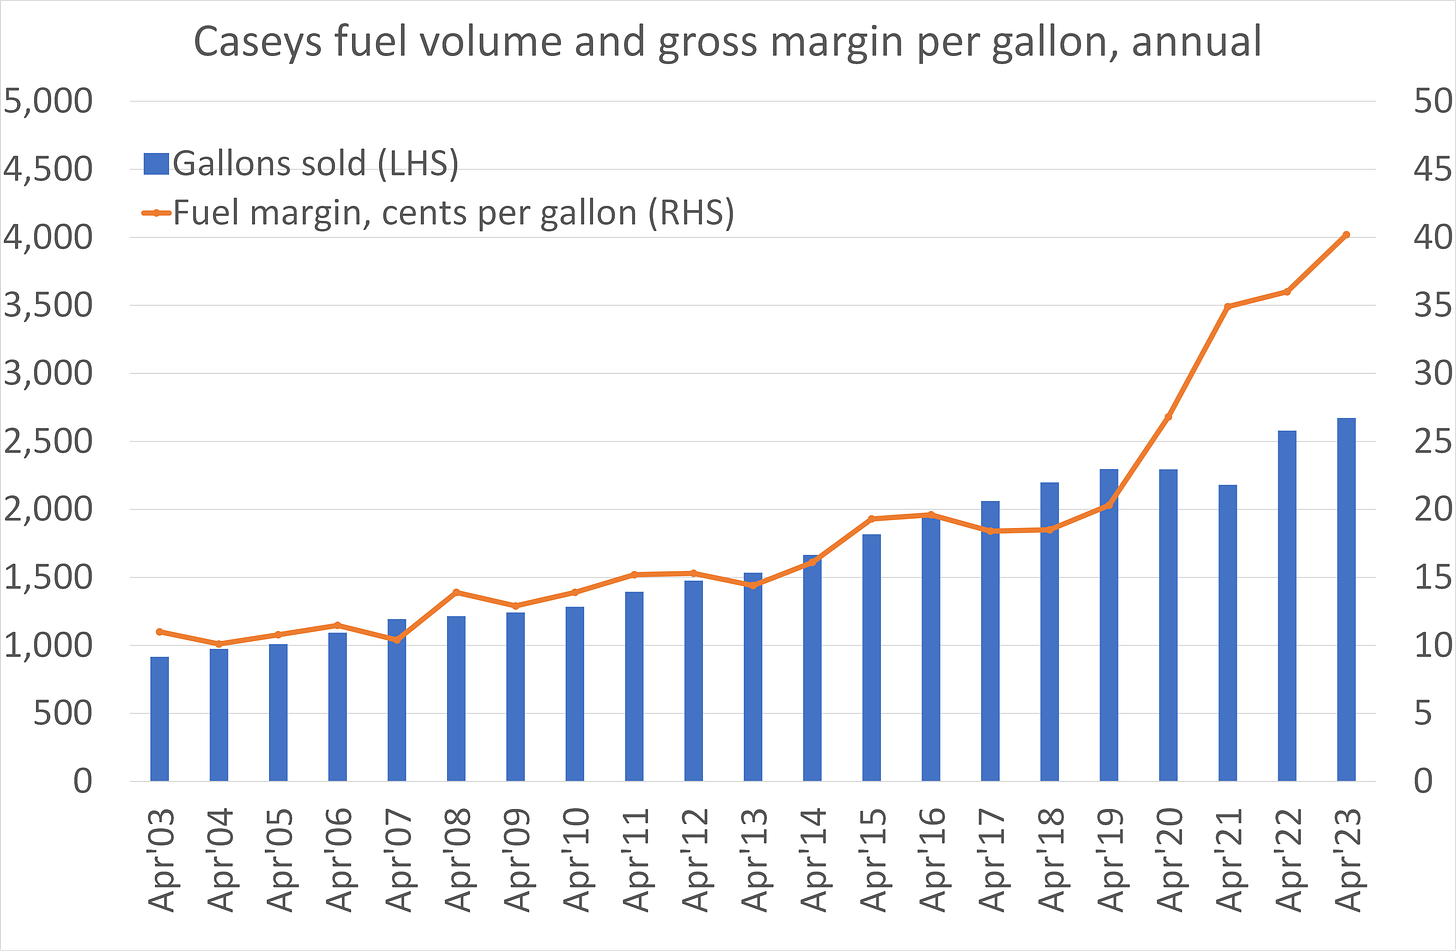
The chart below show Casey’s total fuel volume and gross profit on fuel, expressed in cents per gallon (CPG). Over twenty years the trend was for a gradual increase in fuel margin from about 10 CPG to about 20 CPG. The pandemic then saw a leap to the 35-45 CPG range. To date the fuel margin has remained at these historically high levels.
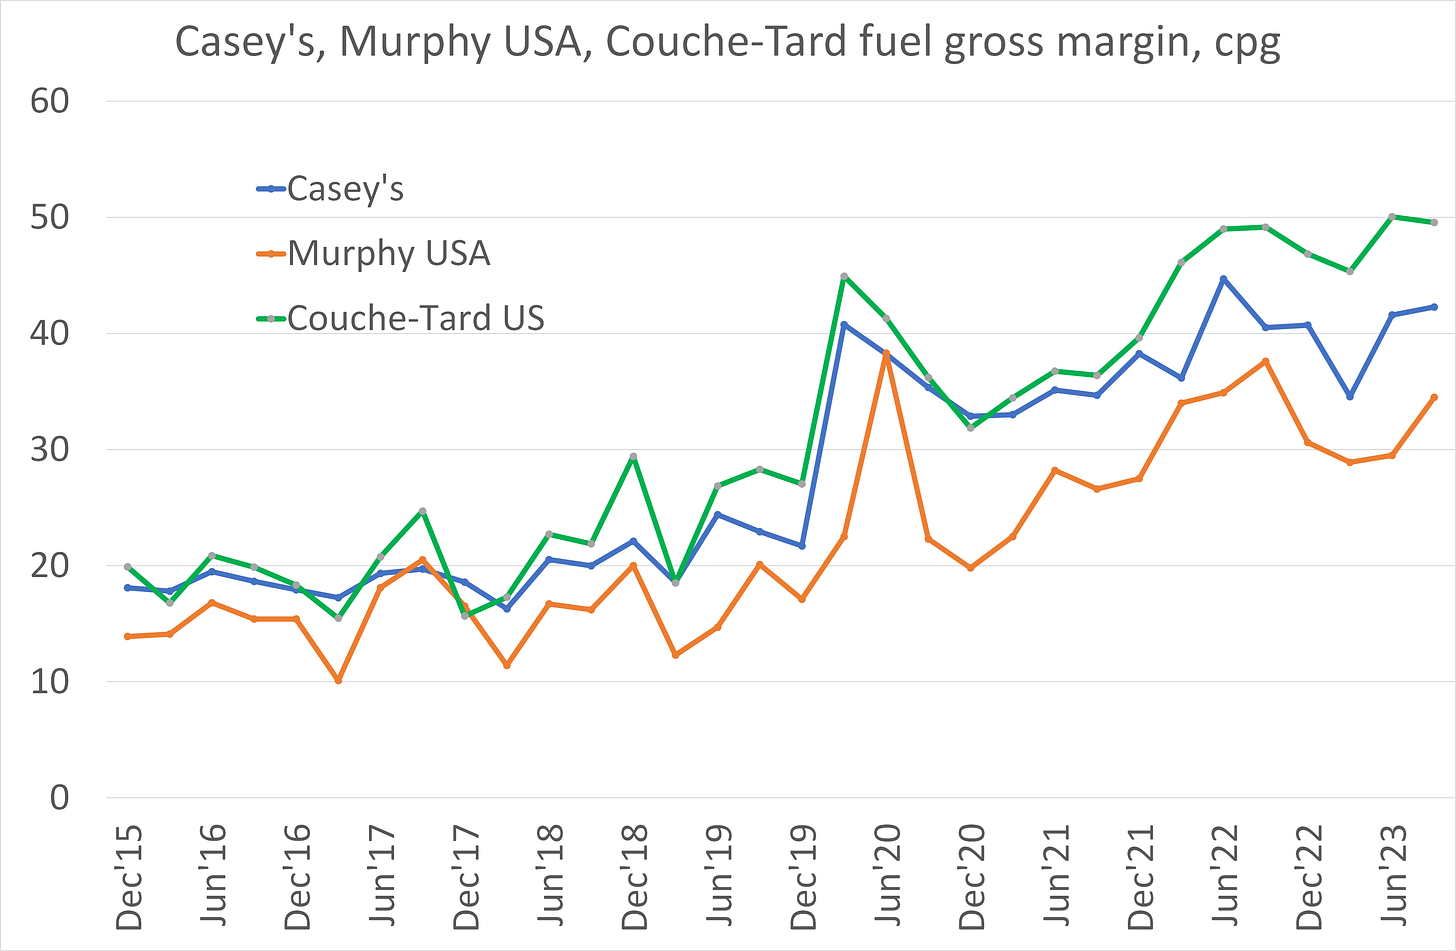
Key listed peers Murphy USA and Couche-Tard have reported similar jumps in fuel margins: see chart below. An industry-wide dynamic is clearly at work.
All three major players explain the change in fuel margin by reference to the fragmented convenience retail industry structure, and specifically the situation of the single-store operators.
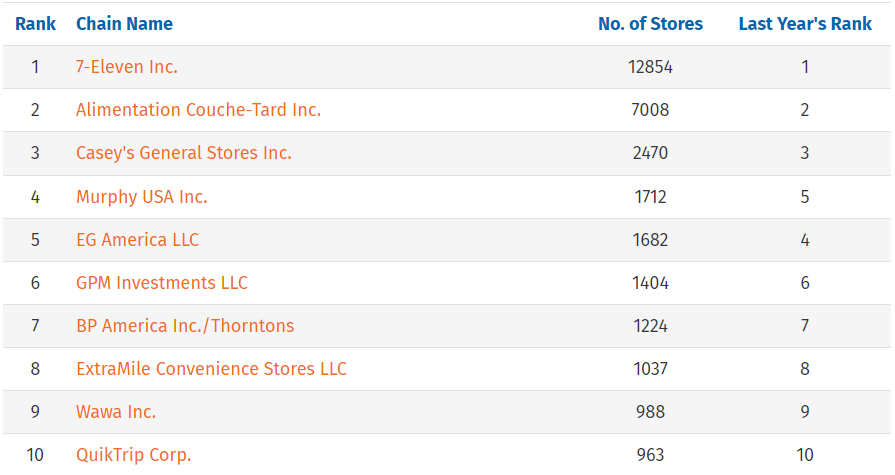
By way of background, Casey’s is ranked #3 by size in the US. (See top ten below at 2022: source.)
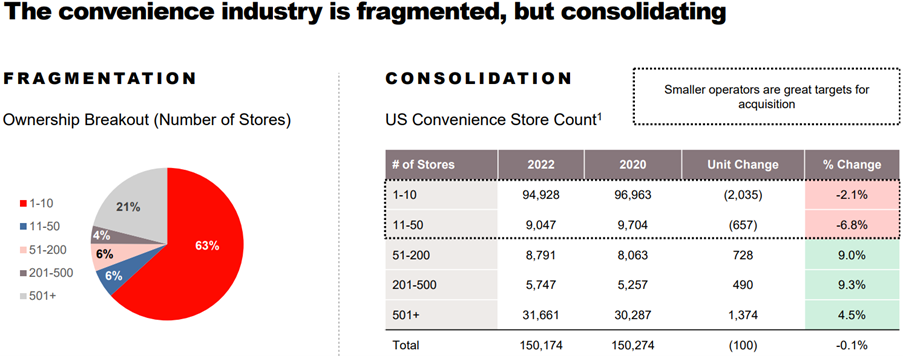
In its markets, Casey’s competes against the convenience giants 7-Eleven and Couche-Tard, local chains such as QuikTrip and Kum & Go, and especially the mom’n’pop stores that make up over half the industry. According to industry organisation NACS:
There are 152,396 convenience stores operating in the United States. About 80% of convenience stores (120,061 total) sell gas, and the industry continues to be dominated by single-store operators, which account for roughly 60% of all stores (91,799 stores). [NACS]
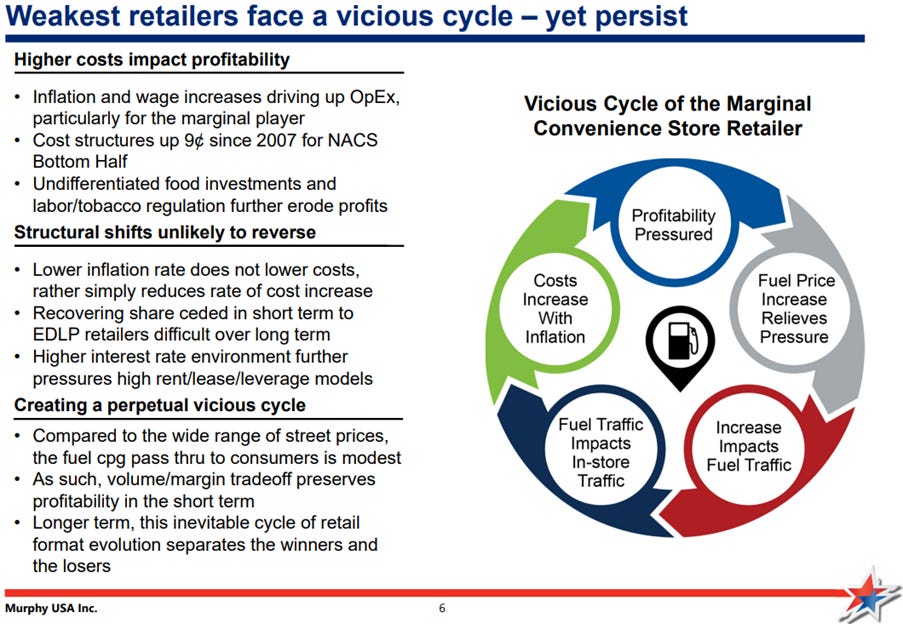
Typically, single-store operators have a weaker cost structure and lower margins, due to a lack of prepared foods and a much higher reliance on tobacco, accounting for 40-50% of inside sales. The inflationary rise in all operating costs, as well as the sharp recent falls in cigarette sales, have put the single-store operators under great pressure. This has forced them to raise their fuel prices – the only lever they can pull – in order to remain above break-even.
In accordance with classical economics, fuel retail in the US is a competitive market. The prevailing market price is set by those marginal retailers. The large chain operators such as Casey’s are price followers. This has translated into higher fuel margins for the big chains as we saw above. On its most recent call in December, Casey’s CEO commented that
“With each passing quarter it becomes more evident that higher industry fuel margins are here to stay.”
Murphy USA summarises the argument aggressively in the slide below (from its Mar’23 deck). As weak retailers hike fuel prices in despair, they lose some volume in response. This implies continued market share gains for the advantaged major players.
The most recent datapoint came from Murphy USA’s Q4’23 results on February 8. They reported a 32.5 cents per gallon fuel margin, up 2 cents yoy and better than expected. CASY jumped 3.6% on the supportive datapoint for higher-for-longer fuel margins.
Peer comparison
The American-listed competitors are ATD, MUSA and ARKO. In addition, 7-Eleven Inc is owned by Seven & i Holdings, listed in Japan under ticker 3382.
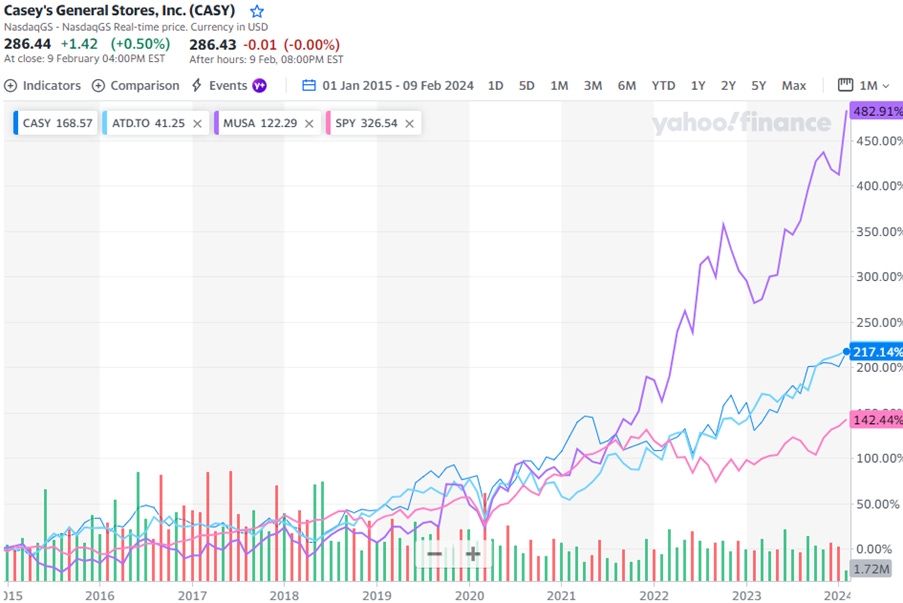
· ATD (Alimentation Couche-Tard) is perhaps closest in strategy and financial profile to Casey’s, albeit it is massive and global in scale. Both ATD and CASY have traded similarly for over a decade as regards both fundamental growth and stock price rating and performance.
· MUSA (Murphy USA) mainly operates gas stations and convenience stores on the Walmart estate, next to Supercenters. It has a different strategy and profile to Casey’s, with lower growth and far higher cash returns to shareholders. MUSA trades at a far lower multiple than CASY and ATD, given the lower growth and higher risk profile. Murphy and Walmart announced a separation in Jan’16, awkwardly leaving Murphy at risk of possible hostile acts by Walmart. Nonetheless, MUSA management have done an outstanding job of maximising free cash flow from their estate. The stock has outperformed CASY and ATD from a depressed start point.
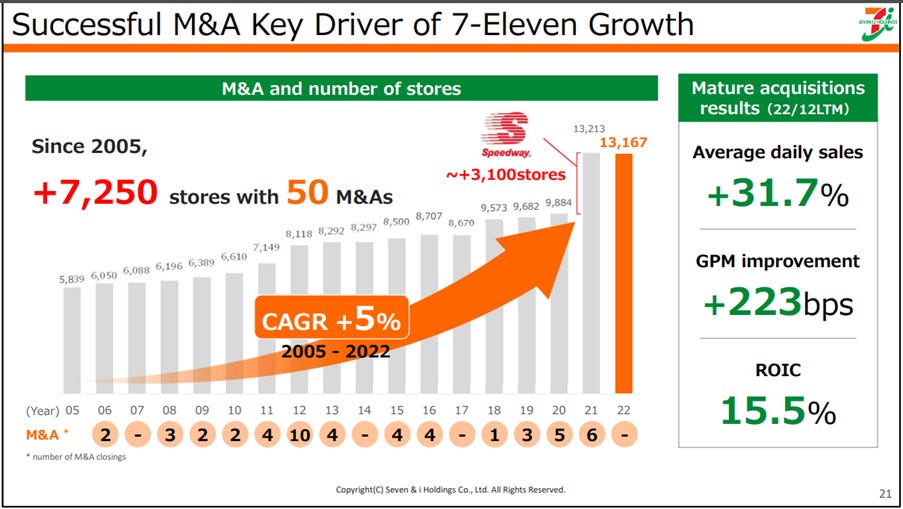
· 7-Eleven Inc (3382:TYO) is the #1 US player with 9% of all stores, given the huge industry fragmentation. They are highly acquisitive – see chart below [source]. In-store they are pursuing similar strategic priorities to Casey’s, with an emphasis on fresh prepared foods and private brands to boost margins. Their different approach to fresh food deploys 17 central commissaries and 16 bakeries to prepare foods off-site for sale in hot food cases, as compared to Casey’s reliance on kitchens in each store. (Each Casey’s store makes its own pizza dough fresh on site daily.)
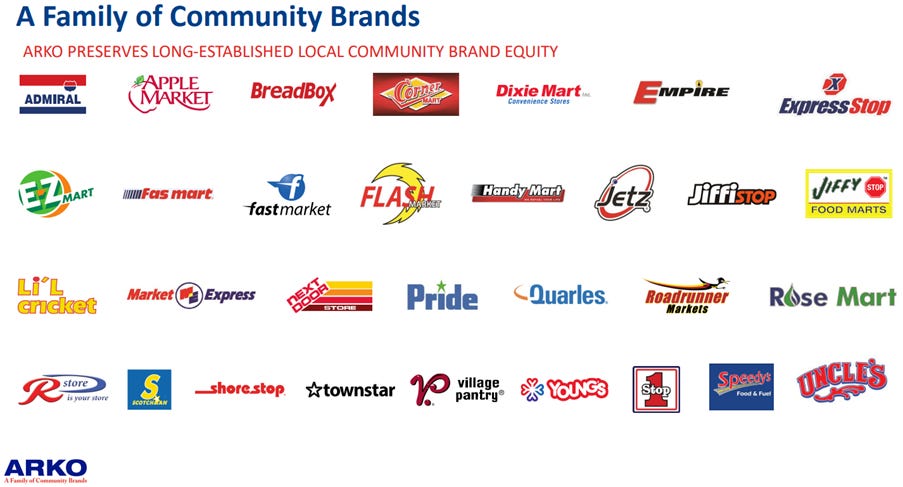
· ARKO is a de-SPAC of a previously Tel Aviv-listed company that owns GPM Investments, the #6 ranked player in the US. It chooses to continue to operate acquired stores under over 30 legacy brand names (see below). The contrast to Casey’s disciplined single-brand, single-format strategy is instructive. ARKO’s market cap of $940m supports debt of $812m and gross future lease liabilities of $3.1bn. I wish shareholders luck.
Financials and forecasts
The historic income statement is shown below.
A few key expenses are worth highlighting.
· Cheese is their biggest soft commodity input cost, and has violent enough swings to impact margins. For the current year the softer cheese price is favourable.
· Credit card fees were an eye-watering $218m in FY23. That is 144bp of revenue, but an amazing 25% of the total value created when expressed as operating profit plus credit card fees.
· Stock-based compensation expense was $47m in FY23. It runs at 7-8% of EBIT per year, a bit higher than I am comfortable with as a non-US investor, but perhaps not egregious in the US market. For the avoidance of doubt, financials are reported cleanly and the charge is not added back to any bogus ‘adjusted’ numbers.
Valuation
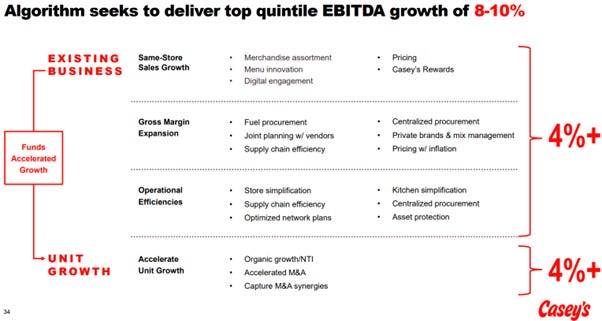
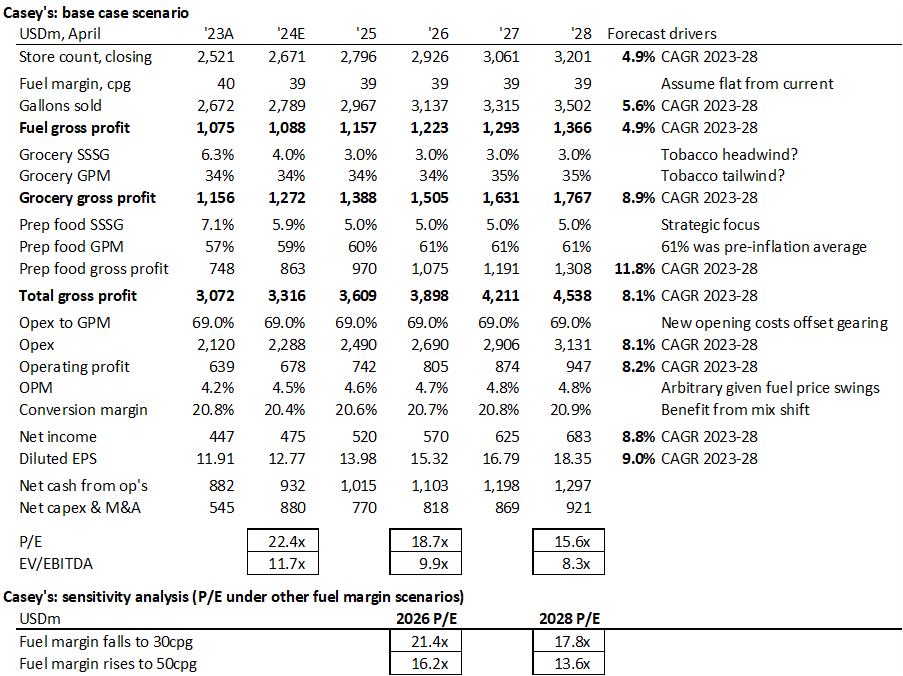
Casey’s currently trades at c.22x P/E. The growth algorithm can potentially deliver 8-10% earnings growth indefinitely (see Casey’s slide). This would make the stock a solid long-term performer if delivered.
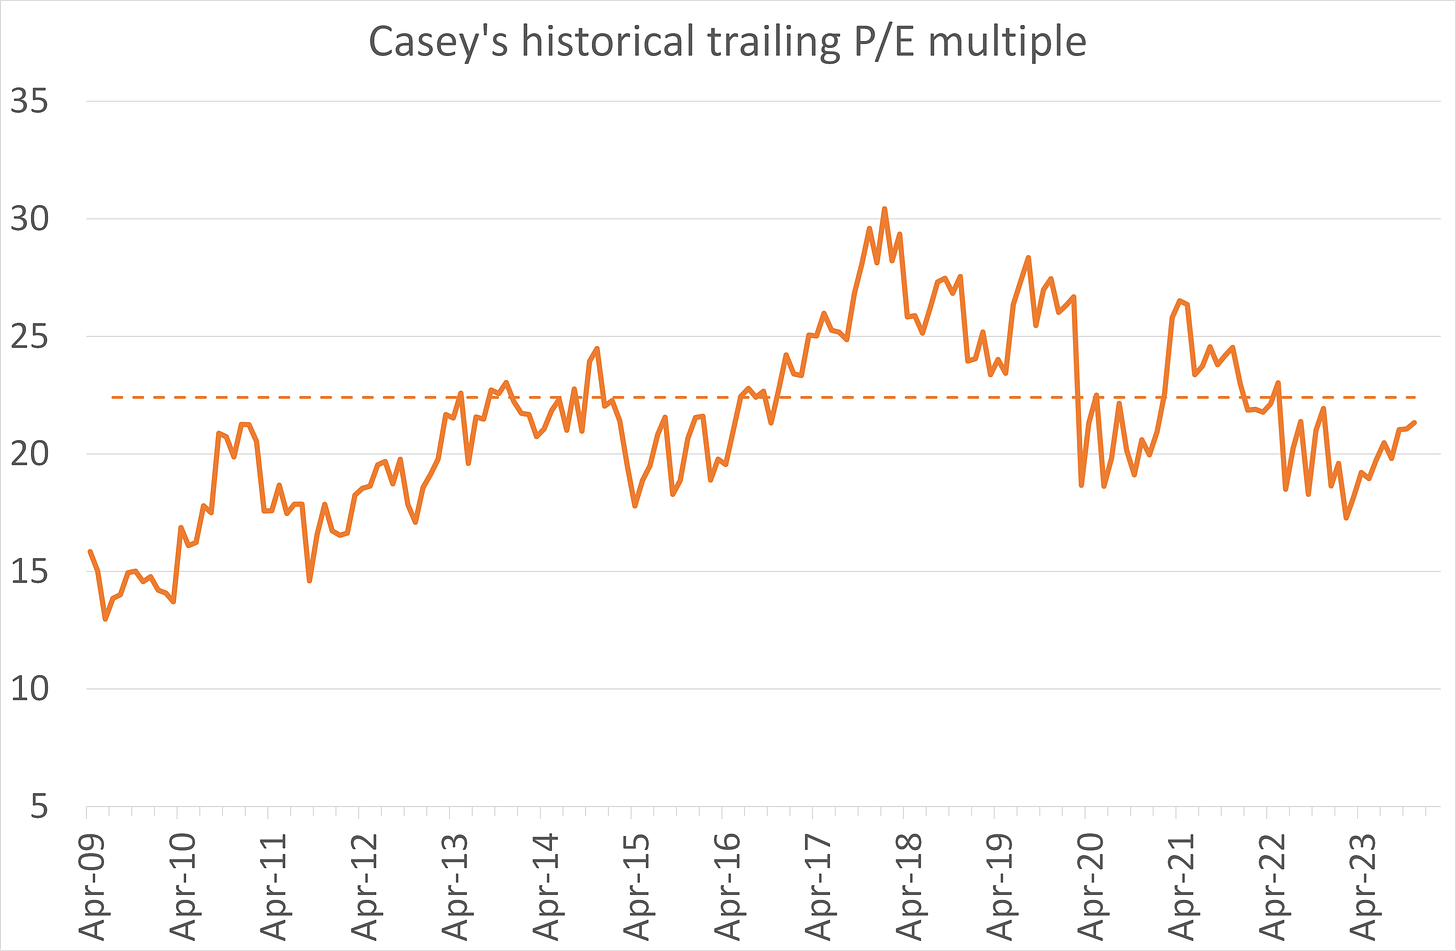
The stock has sustained a fairly high multiple for over a decade, averaging 22.4x over 15 years: see my chart below. The stock currently trades roughly in line with its own history, though I don’t regard this as a sound basis for fundamental valuation.
My base case forecast replicates guidance for just under 10% earnings growth per year. The most unpredictable variable is the fuel margin, where a better- or worse-than-expected outcome could have a big impact on earnings and the stock.
Other assumptions feel conservative or achievable against Casey’s outstanding track record of delivery, such as 3% same-store grocery sales, no uplift in inside gross margins, and no scale benefit factored into the operating expense ratio.
Risk factors and random observations
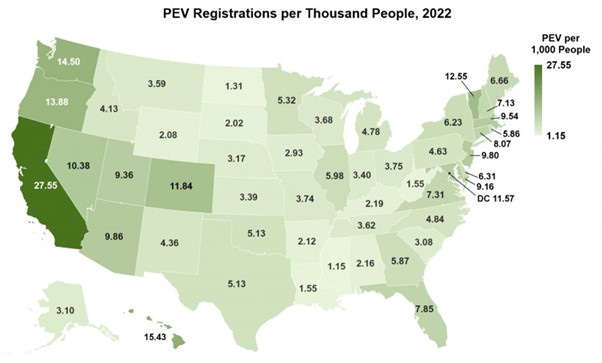
· How will the transition to electric vehicles impact Casey’s gasoline sales? Slowly. The map below shows that Casey’s states have far lower EV adoption than the coastal states, likely due to lower average incomes and higher distances driven. Casey’s has begun installing EV chargers in certain locations, but there is no hurry in this regard.
· Why invest in Casey over Couche-Tard (ATD)? Couche-Tard is an extremely impressive, globally scaled player at a slightly cheaper valuation. However, Casey has pureplay exposure to the highly attractive, fragmented US market. European markets are far more concentrated, without the same opportunity to take share from independents while sheltering under their higher costs. Casey also has close to unlimited white space to grow by acquisition, whereas Couche-Tard may face antitrust resistance to certain acquisitions.
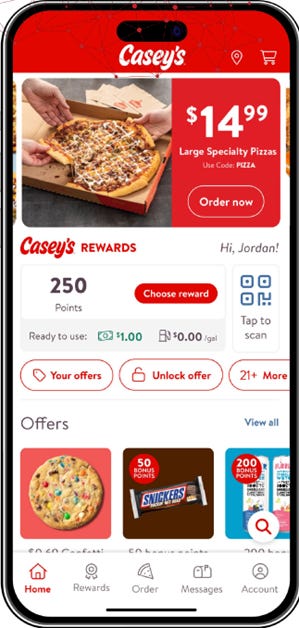
· Casey and the big chain rivals are leveraging loyalty apps with fuel discounts to gain an advantage over single-store operators who cannot afford to invest in tech. Casey’s app is supplied by ParTech (PAR), via its Punchh loyalty platform. PAR might look like a nice business if it wasn’t loss-making! It was lavishly profiled on Capital Allocators With Ted Seides, since when it has been a poor performer. A marginally profitable rival to Punchh is Eagle Eye Solutions (EYE:Lon).
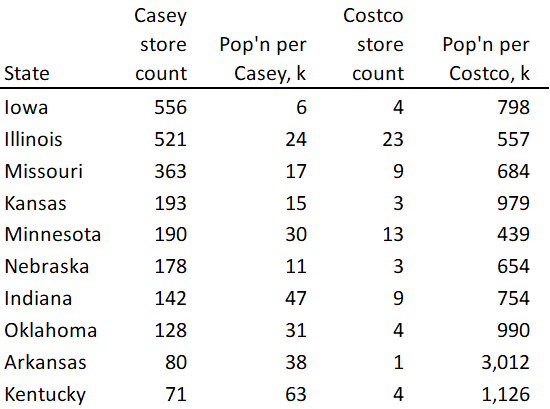
· Costco is famous for selling fuel at low prices as a benefit to its members. Is this a threat? Hardly. Costco’s penetration in ‘Casey country’ is well below the national average, with its tiny number of locations unlikely to be convenient to Casey’s customers. See table below.



great analysis! curious how you’re thinking about population outflow risk from rural towns that casey’s operates in?